
Descripción
¿Cansado de indicadores retrasados y señales falsas? Descubre la fusión definitiva de la teoría de puntos pivote y el momentum SuperTrend que te ofrece puntos de entrada y salida con precisión profesional y exactitud láser.
🌟 ¿QUÉ HACE ESPECIAL A ESTE INDICADOR?
Tecnología de Doble Potencia
- Precisión de Puntos Pivote: Identifica niveles clave de soporte/resistencia usando detección sofisticada de puntos pivote
- Momentum SuperTrend: Combina la volatilidad ATR con precisión de seguimiento de tendencia
- Confirmación Inteligente de Señales: Elimina señales falsas con validación de tendencia incorporada
Características Profesionales
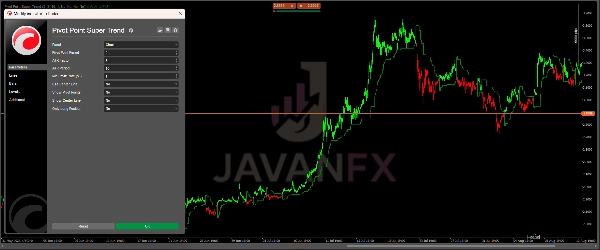
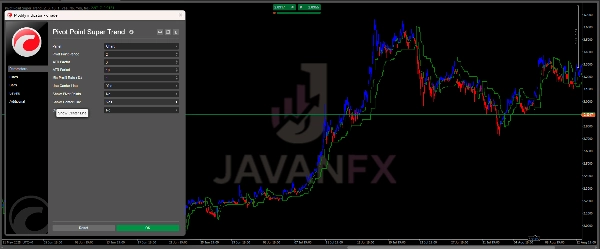
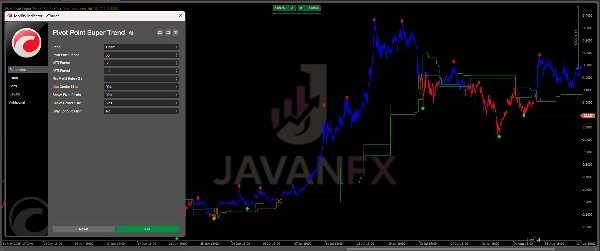
- 🎯 Señales Visuales de Tendencia: Líneas codificadas por colores claras (Verde = Alcista, Rojo = Bajista)
- ⚡ Alertas en Tiempo Real: Notificaciones instantáneas en el escritorio para oportunidades de entrada
- 📊 Puntos Pivote Dinámicos: Detecta automáticamente puntos de giro significativos del mercado
- 🎚️ Totalmente Personalizable: Ajusta la sensibilidad para adaptarse a cualquier estilo de trading o marco temporal
📈 PERFECTO PARA TODOS LOS MERCADOS Y MARCOS TEMPORALES
Traders de Día: Captura tendencias intradía con entradas precisas
Traders Swing: Sigue grandes tendencias con confianza
Traders de Forex y Cripto: Funciona excepcionalmente bien en mercados volátiles
Traders de Acciones y Futuros: Fiable en todos los instrumentos líquidos
🎯 CÓMO USAR (Simple y Poderoso)
Configuración Básica:
- Aplica el indicador a tu gráfico (marcos temporales de 1min a semanal)
- Línea Verde: Precio arriba = señal de COMPRA 📈
- Línea Roja: Precio abajo = señal de VENTA 📉
Señales de Entrada:
- COMPRA cuando la línea se vuelve VERDE y el precio cierra arriba
- VENTA cuando la línea se vuelve ROJA y el precio cierra abajo
- Confirmación: Espera la alineación del punto pivote para mayor precisión
Estrategia de Salida:
- Stop Loss: Debajo/encima de la línea SuperTrend
- Take Profit: Cuando la línea de tendencia cambia de color o en niveles clave de pivote
Características Avanzadas:
- Línea Central: Úsala como soporte/resistencia dinámico para toma parcial de ganancias
- Puntos Pivote: Niveles principales actúan como confirmación para entradas/salidas
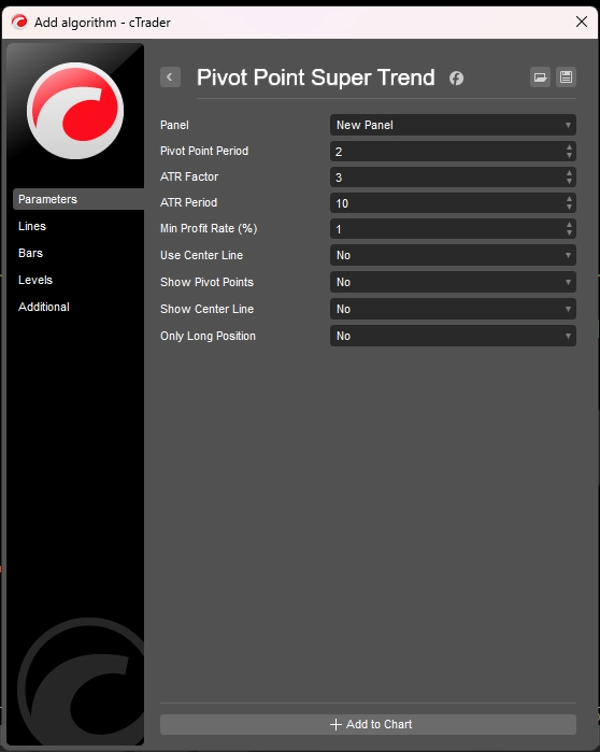
⚙️ CONFIGURACIONES ÓPTIMAS
Trading Diario (1min - 15min):
- Periodo de Pivote: 2-3
- Factor ATR: 2.5-3.5
- Periodo ATR: 10-15
Trading Swing (1H - Diario):
- Periodo de Pivote: 3-5
- Factor ATR: 3-4
- Periodo ATR: 14-20
Trading de Posición (Semanal):
- Periodo de Pivote: 5-7
- Factor ATR: 4-5
- Periodo ATR: 20-25
💡 CONSEJOS PROFESIONALES
- Combina con soporte/resistencia principal para resultados explosivos
- Usa en múltiples marcos temporales para confluencia (p. ej., tendencia 1H + entrada 15min)
- Ajusta el Factor ATR según la volatilidad del mercado
- Realiza backtesting con diferentes configuraciones para tu instrumento específico
Resumen
Key functionalities include color-coded trend lines—green for bullish and red for bearish trends—real-time desktop alerts for trade opportunities, and dynamic pivot points that automatically detect significant market turning points. It is fully customizable, allowing traders to adjust sensitivity settings to suit various trading styles and timeframes.
This indicator supports all markets and timeframes, making it suitable for day traders, swing traders, forex, crypto, stock, and futures traders. Typical usage involves applying the indicator to charts from 1-minute to weekly intervals, interpreting green lines and price above as buy signals, and red lines with price below as sell signals, with pivot point alignment for confirmation. Exit strategies include setting stop losses relative to the SuperTrend line and taking profits at trend changes or pivot levels.
Optimal settings vary by trading style, with specific pivot periods, ATR factors, and ATR periods recommended for day trading, swing trading, and position trading. Additional features include a center line for dynamic support/resistance and partial profit-taking.
Valoraciones de clientes
5 | 100 % | |
4 | 0 % | |
3 | 0 % | |
2 | 0 % | |
1 | 0 % |


