
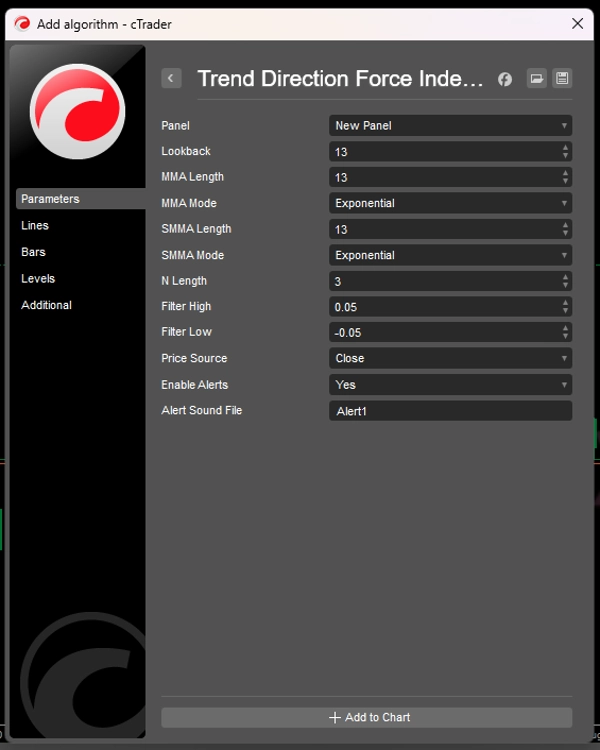
الوصف
مؤشر قوة اتجاه الاتجاه (TDFI) هو مؤشر قوي يعتمد على الزخم مصمم لمساعدة المتداولين على تحديد تحركات الاتجاه القوية والانعكاسات المحتملة بدقة. من خلال تحليل العلاقة بين متوسطين متحركين ومعدل تغيرهما، يقوم TDFI بتصفية ضوضاء السوق ويسلط الضوء على فرص التداول ذات الاحتمالية العالية.
الميزات الرئيسية:
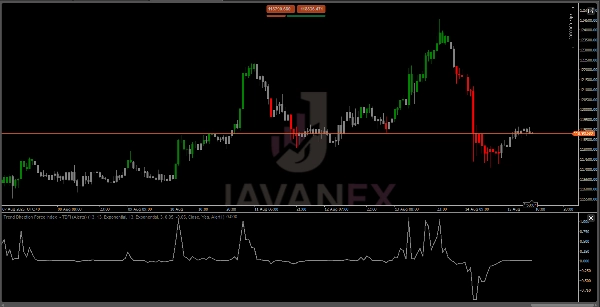
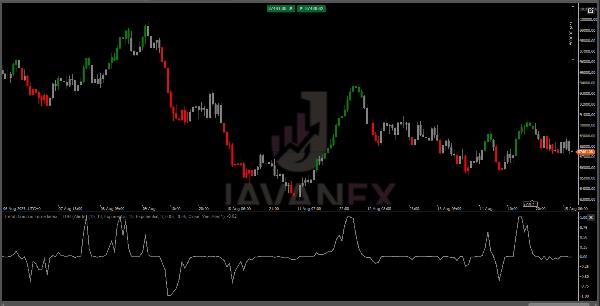
✅ تحديد واضح للاتجاه – يميز بصريًا بين الزخم الصعودي (الأخضر) والهبوطي (الأحمر) بناءً على عتبات قابلة للتخصيص.
✅ تنعيم تكيفي – يستخدم أنواعًا متعددة من المتوسطات المتحركة (EMA، WMA، Hull، TEMA، إلخ) لتحقيق استجابة مثلى.
✅ تقليل الضوضاء – يضمن التطبيع الديناميكي أن تحركات السعر المهمة فقط هي التي تؤدي إلى إشارات.
✅ تنبيهات قابلة للتخصيص – احصل على إشعارات فورية عندما تقوى الاتجاهات أو تنعكس.
✅ يعمل عبر جميع الأطر الزمنية – فعال للتداول السريع، التداول اليومي، والتداول المتأرجح.
كيف يعمل TDFI
يقيس TDFI قوة الاتجاه من خلال تحليل التباعد و الزخم بين متوسطين متحركين مضبوطين خصيصًا:
- MMA (المتوسط المتحرك الرئيسي) – يتتبع زخم السعر قصير الأجل
- SMMA (المتوسط المتحرك المملس) – يحدد الاتجاه الأساسي
ثم يحسب المؤشر:
🔹 قوة التباعد – مدى تباعد المتوسطات المتحركة (قوة الاتجاه)
🔹 تسارع الزخم – مدى سرعة تحرك الاتجاه
🔹 المخرجات المعممة – مقياس الإشارات لتجنب القيم القصوى
عندما تتحد هذه القوى:
- TDFI > العتبة العليا (أخضر) = زخم صعودي قوي
- TDFI < العتبة السفلى (أحمر) = زخم هبوطي قوي
- بين العتبات (رمادي) = حيادي/توحيد
الملخص
تقييمات العملاء
5 | 75 % | |
4 | 25 % | |
3 | 0 % | |
2 | 0 % | |
1 | 0 % |


