
说明
零滞后 LSMA(最小二乘移动平均线) 是一种先进的技术指标,专为寻求增强响应速度和趋势分析精度的交易者设计。与滞后于价格走势的传统移动平均线不同,它通过应用双重线性回归过程来最小化滞后,非常适合实时识别趋势方向和潜在反转。该指标适用于外汇、股票、商品及其他市场。
主要特点
- 零滞后性能:减少传统移动平均线固有的延迟,提供更快的趋势变化信号。
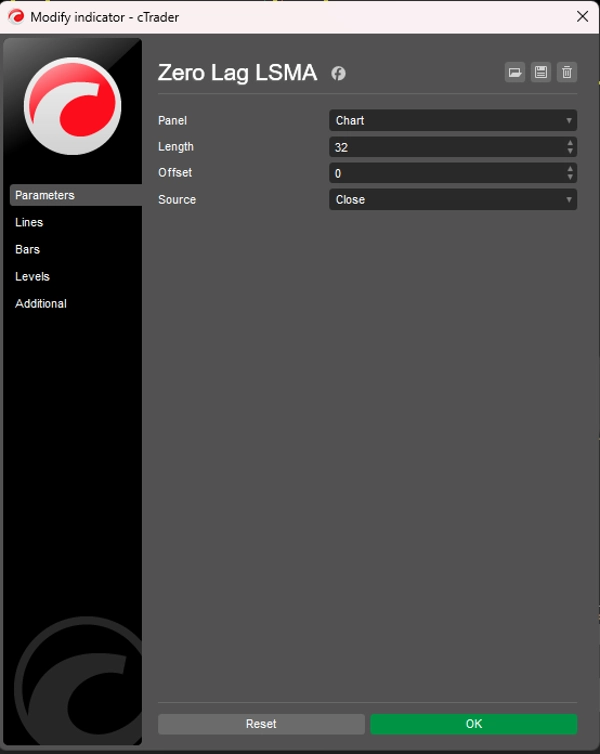
- 可定制参数:调整长度、偏移量和价格来源(开盘价、高价、低价、收盘价)以适应您的交易策略。
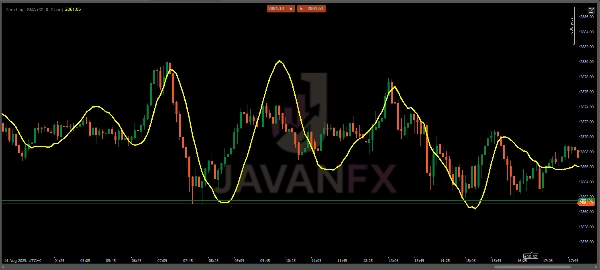
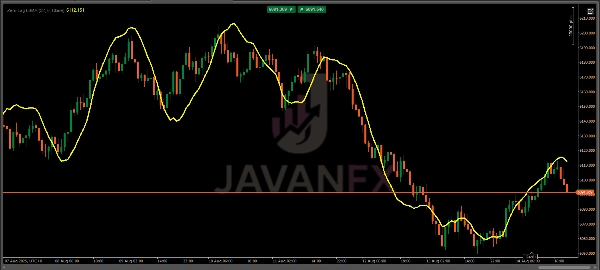
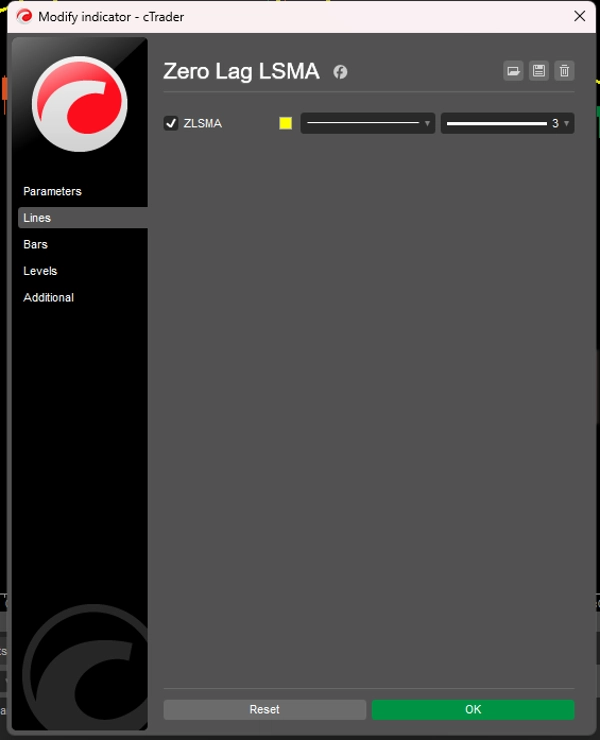
- 直观显示:以平滑的黄色线条显示在价格图表上,便于解读。
- 多用途应用:适用于剥头皮、日内交易、波段交易及各种时间框架的长期策略。
使用方法
- 趋势识别:
-
- 当 ZLSMA 线向上倾斜时,表示看涨趋势。
- 向下倾斜则表明看跌趋势。
- 平坦或波动的走势可能表示盘整或缺乏趋势。
- 进出场信号:
-
- 买入信号:当价格突破 ZLSMA 线向上,尤其是在确认的上升趋势后,进入多头仓位。
- 卖出信号:当价格在下降趋势中跌破 ZLSMA 线时,进入空头仓位。
- 退出信号:当价格再次穿过 ZLSMA 线或该线趋于平坦时,考虑退出,表明潜在的趋势反转。
- 确认:
-
- 结合其他指标(如 RSI、MACD)或支撑/阻力位确认信号,避免假突破。
- 在更高时间框架(H1、H4、D1)上使用以获得更强的趋势信号,或在较低时间框架(M5、M15)上用于剥头皮交易。
交易策略
- 顺势交易:利用 ZLSMA 顺势而为,在趋势方向上的回调时入场。
- 反转交易:寻找价格与 ZLSMA 线的背离,结合蜡烛图形态(如针形线、吞没形态)进行反转布局。
- 突破交易:监控高波动期价格突破 ZLSMA 线的情况,寻找潜在入场点。
最佳使用建议
- 根据市场状况调整长度:快速市场或剥头皮交易使用较短长度(如 10-20),高时间框架中平滑趋势使用较长长度(如 50-100)。
- 在模拟账户中测试:在实盘交易前,在模拟账户中回测 ZLSMA,以了解其在您偏好市场中的表现。
- 避免在震荡市场中过度交易:ZLSMA 在趋势市场表现最佳;使用额外过滤器(如 ADX)避免震荡市中的假信号。
摘要
AI 摘要
The Zero Lag LSMA (Least Squares Moving Average) is a technical indicator designed to enhance trend analysis by minimizing the lag typical of traditional moving averages. It uses a double linear regression process to provide faster and more responsive signals, making it suitable for real-time identification of trend direction and potential reversals. The indicator is applicable across various markets including forex, stocks, and commodities.
Key features include customizable parameters such as length, offset, and price source (Open, High, Low, Close), allowing adaptation to different trading strategies. It displays as a smooth yellow line overlaid on the price chart for clear visual interpretation. The indicator supports multiple trading styles and timeframes, from scalping to long-term strategies.
Traders use the Zero Lag LSMA to identify trends by observing the slope of the line: upward for bullish trends, downward for bearish, and flat for consolidation. Entry and exit signals are generated when price crosses the LSMA line, with additional confirmation recommended through other indicators or support/resistance levels. The indicator supports trend following, reversal, and breakout trading strategies, with adjustable settings to optimize performance under varying market conditions.
指标配置
客户评价
4.6
评价:3
5 | 67 % | |
4 | 33 % | |
3 | 0 % | |
2 | 0 % | |
1 | 0 % |
客户评价
October 10, 2025
Zero lag, full clarity ⚡ LSMA tracks price action like a scalpel — sharp, fast, and smooth. Great trend filter for any timeframe!
August 27, 2025
The only reason it stays interesting is the setup needs less second guessing. A normal demo run is enough to see the weak spots.
August 16, 2025
Not bad if the rules are already clear. Spread and slippage need a line in the notes.
讨论
常见问答
cTrader Store 提供的所有产品,包括交易机器人、指标和插件,均由第三方开发者提供,仅供信息参考和技术访问之用。cTrader Store 并非经纪商,不提供投资建议、个人推荐或任何未来业绩保证。


猜您喜欢


价格
注册日期 14/07/2025
60
销售