
Fx4U.Multi TimeFrame Support & Resistance
指标
8 购买
版本 1.0, Oct 2024
Windows 版、Mac 版
4.3
评价:3
说明
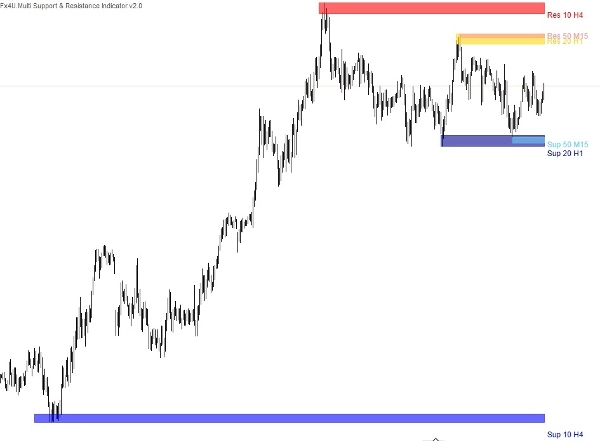
多时间框架支撑和阻力指标通常允许交易者在不同的时间框架上可视化这些水平,例如小时图、日图、周图或月图。通过结合多个时间框架,交易者可以获得更广泛的视角,了解关键价格水平的位置以及它们如何影响价格走势。
这种类型的指标可以帮助交易者通过识别可能影响不同时间框架内价格变动的重要支撑和阻力水平,从而做出更明智的交易决策。它还可以帮助交易者在价格接近多个时间框架的这些水平时,预判潜在的反转或突破机会。
支撑和阻力水平有三种类型:
这三个支撑和阻力指标集成在这个单一指标中,允许您使用以下设置在图表上绘制您的供需区。
- 周期值。
- 时间框架。
- 极值数量 – 这是显示的当前及过去支撑/阻力点的数量。例如,如果选择2,指标将选择过去的另一个支撑和阻力点。
- 指标的名称和颜色。
在较高时间框架上重要的支撑和阻力水平往往更具分量,通过使用多时间框架指标,交易者可以确认某一水平如果在多个时间框架中持续出现的重要性。这种确认提高了该水平的可靠性,增强了交易者对其交易决策的信心。
我的其他产品:
https://ctrader.com/products/346
https://ctrader.com/products/336
https://ctrader.com/products/343
https://ctrader.com/products/347
https://ctrader.com/products/147
摘要
AI 摘要
Fx4U.Multi TimeFrame Support & Resistance is a trading indicator designed to display key support and resistance levels across multiple timeframes, including hourly, daily, weekly, and monthly charts. By integrating these timeframes, it provides traders with a comprehensive view of significant price levels that may influence market movements.
The indicator consolidates three types of support and resistance levels into a single tool, allowing users to plot supply and demand zones with customizable settings such as period value, timeframe, the number of extremum points (current plus past support/resistance points), and indicator name and color. This multi-timeframe approach helps traders identify levels that carry more weight when confirmed across different timeframes, enhancing the reliability of these levels for decision-making.
By visualizing these critical zones, the indicator aids in anticipating potential price reversals or breakout opportunities. It supports a broader market overview, enabling more informed trading strategies based on the interaction of price with established support and resistance across various time horizons.
指标配置
客户评价
4.3
评价:3
5 | 33 % | |
4 | 67 % | |
3 | 0 % | |
2 | 0 % | |
1 | 0 % |
客户评价
October 18, 2024
Usable trading support if the trader wants it keeps attention on levels that actually matter. It works best as support, not a final decision maker. The cleanest use is 3 to 5 levels per chart, with 0.5 pullbacks checked before entry. not every zone holds, even if it looks clean.
October 17, 2024
October 17, 2024
Solid chart aid for traders who build plans around market levels. It gives value around key price zones, but not every zone holds, even if it looks clean. I would wait for 2 reactions and avoid trades where the target is less than 1.5R. Levels are useful when they reduce noise, not when they crowd the chart.
讨论
常见问答
Breakout
cTrader Store 提供的所有产品,包括交易机器人、指标和插件,均由第三方开发者提供,仅供信息参考和技术访问之用。cTrader Store 并非经纪商,不提供投资建议、个人推荐或任何未来业绩保证。
该作者的其他作品
!["[Fx4U] GBPUSD - Price Action" 标识](https://cdn.ctrader.com/image/webp/d80b34fc-da3c-4f01-a321-456450665649_26190)

!["[Fx4U] CADJPY - Price Action" 标识](https://cdn.ctrader.com/image/webp/1ba81247-b6b7-4f3c-a297-fa3eb1d57fe1_26195)

!["[Fx4U] EURAUD - Price Action" 标识](https://cdn.ctrader.com/image/webp/baf8dde4-1ef3-4beb-8ae2-0fed8320f65d_26177)

!["[Fx4U] AUDCHF - Price Action" 标识](https://cdn.ctrader.com/image/webp/0a22e9aa-c83b-42cd-b0b8-c1a2da593207_26148)


!["Smart Money Concepts (SMC) [Iridio Capital]" 标识](https://cdn.ctrader.com/image/webp/28b69fd1-ef54-4bed-9487-07e78e883be4_40934)

价格
11.64M
交易量
165.2K
盈利点数
52
销售
4.7K
免费安装