
Beschreibung
Pinescriptlabs Store Indikatoren: Pinescriptlabs Store cBots : (cBot) Gold & BTC BreakoutSession Pivots(neu)
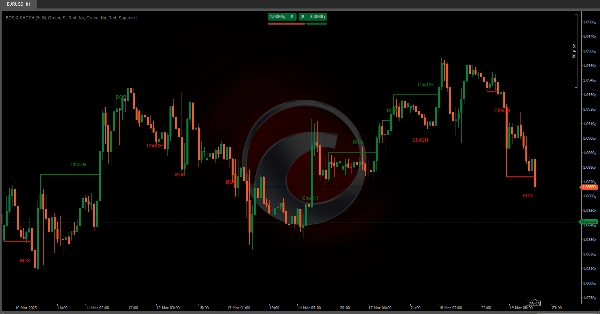
Erweiterte Marktstruktur: Bos, Choch, SwinLevels, Order Blocks, Marktstruktur & Liquiditätsfinder (Neu)
ZigZag Preis-Liquiditätsprojektion
Trailing Smart Algorithmus (neu)
Vorhersage basierend auf Linreg & ATR
SmartTrend Unterstützung &
Widerstand
Linien
Dynamische
Marktstruktur
Analyse
von
Wendepunkten
Punkten
Fibonacci
Lineare
Regression
Multi-Zeitrahmen
Multi-Level
Kerzen-Bias
Tracker
Reaktive gleitende Durchschnitt
Auto
Unterstützung und
Widerstand
Trend
Linien
Alle
Unterstützungs- und
Widerstandsniveaus
Levels
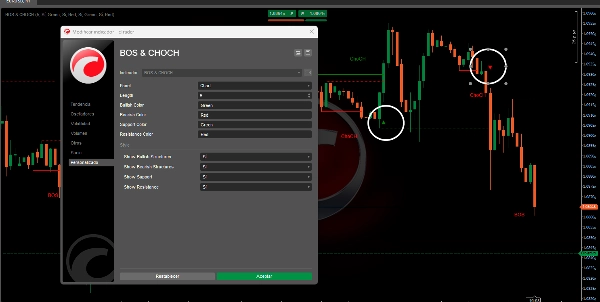
Der Algorithmus ist darauf ausgelegt, marktstrukturelle Muster zu erkennen, insbesondere die Konzepte des Wechsel des Charakters (ChoCH) 🔄 und Strukturbruchs (BoS) 💥. Im Folgenden erkläre ich ausführlich, was dieser Algorithmus macht, seinen Zweck und wie er diese beiden Konzepte identifiziert.
Was macht der Algorithmus?
Der Algorithmus verwendet Fraktale (lokale Hoch- und Tiefpunkte), um zu bestimmen, ob der Preis sein Verhalten geändert oder eine zuvor etablierte Struktur durchbrochen hat. Nachfolgend die Hauptfunktionen:
Fraktalerkennung 📊
- Ein bullishes Fraktal tritt auf, wenn es ein lokales Hoch gibt, bei dem die Kerzen auf beiden Seiten niedriger sind. 📈
- Ein bärisches Fraktal tritt auf, wenn es ein lokales Tief gibt, bei dem die Kerzen auf beiden Seiten höher sind. 📉
- Diese Fraktale dienen als Bezugspunkte zur Identifizierung von Veränderungen in der Marktstruktur.
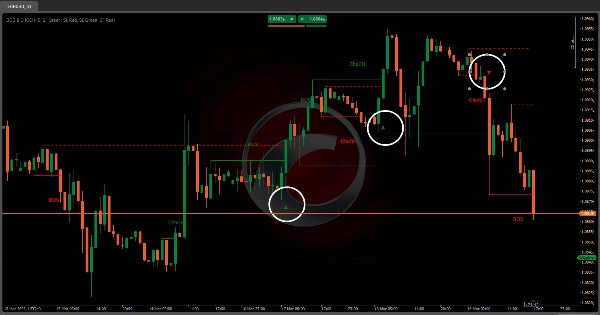
Identifikation von ChoCH (Wechsel des Charakters) 🔄
- Ein bullishes ChoCH tritt auf, wenn der Preis ein bullishes Fraktal überschreitet, ohne zuvor eine vollständige bärische Struktur zu bilden.
- Ein bärisches ChoCH tritt auf, wenn der Preis unter ein bärisches Fraktal fällt, ohne zuvor eine vollständige bullishe Struktur zu bilden.
- Dies zeigt an, dass der Markt seinen Charakter geändert hat (vom Trend zur Konsolidierung oder umgekehrt).
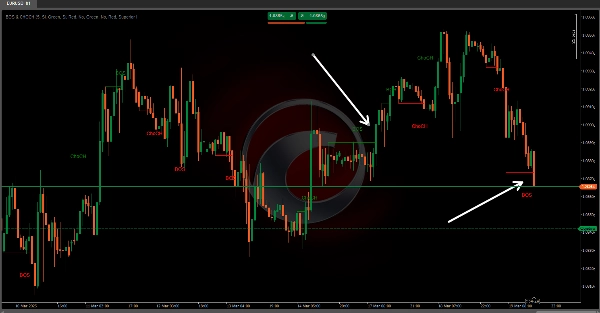
Identifikation von BoS (Strukturbruch) 💥
- Ein bullishes BoS tritt auf, wenn der Preis ein bullishes Fraktal überschreitet, nachdem zuvor eine vollständige bärische Struktur gebildet wurde.
- Ein bärisches BoS tritt auf, wenn der Preis unter ein bärisches Fraktal fällt, nachdem zuvor eine vollständige bullishe Struktur gebildet wurde.
- Dies zeigt an, dass der Markt eine zuvor etablierte Struktur durchbrochen hat, was ein wichtiger Ein- oder Ausstiegspunkt sein kann.
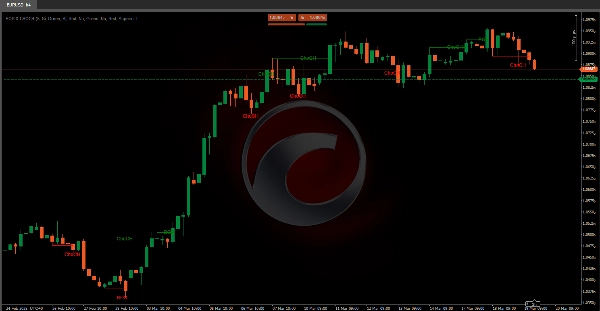
Visualisierung von Unterstützung und Widerstand 🛡️
- Der Algorithmus kann Unterstützungs- und Widerstandslinien basierend auf den erkannten Fraktalen zeichnen.
- Er überprüft auch, ob diese Linien durchbrochen werden, und markiert die Ausbruchspunkte mit visuellen Symbolen.
Dieser Algorithmus bietet Händlern wertvolle Einblicke in das Marktverhalten, indem er wichtige strukturelle Veränderungen und potenzielle Ausbruchsmöglichkeiten klar identifiziert. Durch die Nutzung von ChoCH 🔄 und BoS 💥 Signalen können Händler fundiertere Entscheidungen über Ein- und Ausstiege sowie die allgemeine Marktdynamik treffen.
Zusammenfassung
Key functionalities include:
- **Fractal Detection:** Identifies bullish fractals (local highs with lower candles on both sides) and bearish fractals (local lows with higher candles on both sides).
- **Change of Character (ChoCH):** Signals when the market changes its behavior, such as shifting from trend to consolidation, by surpassing fractals without forming a complete opposite structure.
- **Break of Structure (BoS):** Indicates when the market breaks a previously established structure, marking potential entry or exit points.
- **Support and Resistance Visualization:** Draws support and resistance lines based on fractals and marks breakout points with visual icons.
This indicator aids traders in understanding market dynamics by clearly highlighting structural changes and breakout opportunities, supporting more informed trading decisions.
Kundenbewertungen
5 | 100 % | |
4 | 0 % | |
3 | 0 % | |
2 | 0 % | |
1 | 0 % |


