Opis
Czym jest wskaźnik linii trendu?
Wskaźnik linii trendu to narzędzie analizy technicznej używane przez traderów i analityków do identyfikacji kierunku i siły trendu na rynku finansowym. Opiera się na rysowaniu prostej linii łączącej dwa lub więcej punktów cenowych na wykresie. Głównym celem linii trendu jest wizualne przedstawienie ogólnego kierunku ruchu cen w określonym okresie.
Wskaźnik linii trendu na wielu ramach czasowych
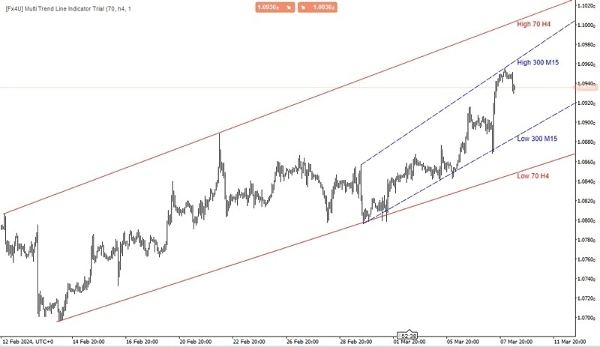
Główną funkcją wskaźnika linii trendu na wielu ramach czasowych jest dostarczenie traderom szerszej perspektywy trendów rynkowych poprzez agregowanie informacji z różnych ram czasowych. Analizując trendy na wielu ramach czasowych, traderzy mogą podejmować lepiej poinformowane decyzje dotyczące potencjalnych punktów wejścia i wyjścia oraz ogólnego kierunku rynku.
Ten typ wskaźnika zazwyczaj pozwala traderom dostosować ramy czasowe, które chcą analizować, i odpowiednio rysować linie trendu. Może to być cenne narzędzie do identyfikacji kluczowych poziomów wsparcia i oporu, odwróceń trendu oraz kontynuacji trendu na różnych ramach czasowych, wspomagając tym samym traderów w podejmowaniu dokładniejszych decyzji handlowych.
Istnieje kilka rodzajów linii trendu, w tym:
- Linia trendu wzrostowego: Rysowana jest przez połączenie dwóch lub więcej kolejnych minimów na wykresie cenowym. Sugeruje trend wzrostowy, wskazując, że ceny generalnie rosną z upływem czasu.
- Linia trendu spadkowego: Natomiast linia trendu spadkowego jest rysowana przez połączenie dwóch lub więcej kolejnych maksimów na wykresie cenowym. Sugeruje trend spadkowy, wskazując, że ceny generalnie spadają z upływem czasu.
- Linia trendu poziomego: Znana również jako linie wsparcia lub oporu, są rysowane poziomo, aby wskazać obszary, gdzie ruch cen ma tendencję do zatrzymania się lub odwrócenia.
Traderzy często używają linii trendu w połączeniu z innymi wskaźnikami technicznymi i metodami analizy, aby podejmować świadome decyzje handlowe. Gdy linia trendu zostanie przełamana lub naruszona, może to wskazywać na potencjalną zmianę kierunku trendu, dostarczając sygnałów handlowych dla inwestorów.
Moje inne produkty:
https://ctrader.com/products/346
https://ctrader.com/products/336
https://ctrader.com/products/343
https://ctrader.com/products/347
https://ctrader.com/products/148
Podsumowanie
This multi-timeframe indicator aggregates trend information across customizable timeframes, providing a comprehensive market overview. It supports the identification of upward, downward, and horizontal trendlines, which correspond to rising trends, falling trends, and support or resistance levels, respectively. By integrating trendlines from various timeframes, traders can better detect trend continuations, reversals, and key support/resistance zones.
The indicator assists in making informed trading decisions by highlighting potential entry and exit points based on trendline breaks or breaches. It is intended for use alongside other technical indicators and analysis methods to enhance market interpretation and trading accuracy.
Opinie klientów
5 | 67 % | |
4 | 0 % | |
3 | 33 % | |
2 | 0 % | |
1 | 0 % |
![Logo „[Fx4U] GBPUSD - Price Action”](https://cdn.ctrader.com/image/webp/d80b34fc-da3c-4f01-a321-456450665649_26190)

![Logo „[Fx4U] CADJPY - Price Action”](https://cdn.ctrader.com/image/webp/1ba81247-b6b7-4f3c-a297-fa3eb1d57fe1_26195)

![Logo „[Fx4U] AUDCHF - Price Action”](https://cdn.ctrader.com/image/webp/0a22e9aa-c83b-42cd-b0b8-c1a2da593207_26148)

![Logo „[Fx4U] EURAUD - Price Action”](https://cdn.ctrader.com/image/webp/baf8dde4-1ef3-4beb-8ae2-0fed8320f65d_26177)