Opis
Wskaźniki wsparcia i oporu na wielu ramach czasowych zazwyczaj pozwalają traderom wizualizować te poziomy na różnych interwałach czasowych, takich jak wykresy godzinowe, dzienne, tygodniowe czy miesięczne. Dzięki uwzględnieniu wielu ram czasowych, traderzy mogą uzyskać szerszą perspektywę na to, gdzie znajdują się kluczowe poziomy cenowe i jak mogą one wpływać na ruchy cen.
Tego typu wskaźnik może pomóc traderom podejmować bardziej świadome decyzje handlowe, identyfikując istotne poziomy wsparcia i oporu, które mogą wpływać na ruchy cen w różnych ramach czasowych. Może również pomóc traderom przewidzieć potencjalne odwrócenia trendu lub okazje do wybicia, gdy cena zbliża się do tych poziomów na wielu ramach czasowych.
Istnieją trzy rodzaje poziomów wsparcia i oporu:
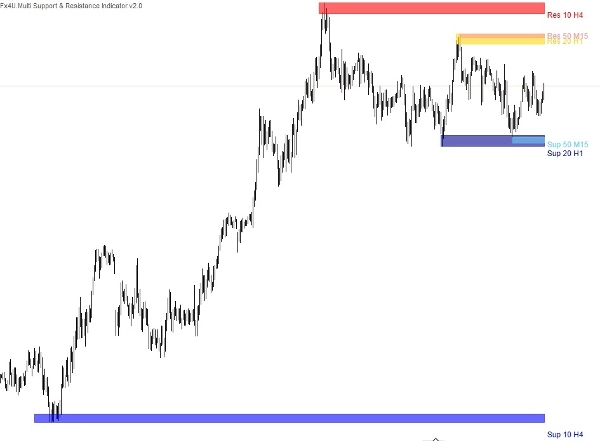
Trzy wskaźniki wsparcia i oporu są zintegrowane w tym jednym wskaźniku, co pozwala na naniesienie stref podaży i popytu na wykres z następującymi ustawieniami.
- Wartość okresu.
- Ram czasowy.
- Liczba ekstremów – To liczba aktualnych + przeszłych punktów wsparcia/oporu wyświetlanych. Na przykład, jeśli wybierzemy 2, wskaźnik wybierze kolejny punkt wsparcia i oporu z przeszłości.
- Nazwa i kolor wskaźnika.
Poziomy wsparcia i oporu, które są istotne na wyższych ramach czasowych, zazwyczaj mają większe znaczenie, a korzystając z wskaźnika wieloramowego, traderzy mogą potwierdzić ważność poziomu, jeśli pojawia się on konsekwentnie na wielu ramach czasowych. To potwierdzenie zwiększa wiarygodność poziomu i wzmacnia pewność traderów w ich decyzjach handlowych.
Moje inne produkty:
https://ctrader.com/products/346
https://ctrader.com/products/336
https://ctrader.com/products/343
https://ctrader.com/products/347
https://ctrader.com/products/147
Podsumowanie
The indicator consolidates three types of support and resistance levels into a single tool, allowing users to plot supply and demand zones with customizable settings such as period value, timeframe, the number of extremum points (current plus past support/resistance points), and indicator name and color. This multi-timeframe approach helps traders identify levels that carry more weight when confirmed across different timeframes, enhancing the reliability of these levels for decision-making.
By visualizing these critical zones, the indicator aids in anticipating potential price reversals or breakout opportunities. It supports a broader market overview, enabling more informed trading strategies based on the interaction of price with established support and resistance across various time horizons.
Opinie klientów
5 | 33 % | |
4 | 67 % | |
3 | 0 % | |
2 | 0 % | |
1 | 0 % |
![Logo „[Fx4U] GBPUSD - Price Action”](https://cdn.ctrader.com/image/webp/d80b34fc-da3c-4f01-a321-456450665649_26190)

![Logo „[Fx4U] CADJPY - Price Action”](https://cdn.ctrader.com/image/webp/1ba81247-b6b7-4f3c-a297-fa3eb1d57fe1_26195)

![Logo „[Fx4U] AUDCHF - Price Action”](https://cdn.ctrader.com/image/webp/0a22e9aa-c83b-42cd-b0b8-c1a2da593207_26148)

![Logo „[Fx4U] EURAUD - Price Action”](https://cdn.ctrader.com/image/webp/baf8dde4-1ef3-4beb-8ae2-0fed8320f65d_26177)