
Beschreibung
HIO Inside Bar Scanner Standard: Verpassen Sie nie wieder ein Setup auf cTrader!
1. Einführung
Verpassen Sie nie wieder eine Handelsgelegenheit mit dem HIOInsideBarScanner! Dieser ultimative cTrader-Assistent durchsucht den gesamten Markt, um Inside Bar Setups mit hoher Wahrscheinlichkeit zu entdecken. Hören Sie auf, manuell durch Charts zu blättern – lassen Sie das System die schwere Arbeit für Sie erledigen!
2. Hauptmerkmale
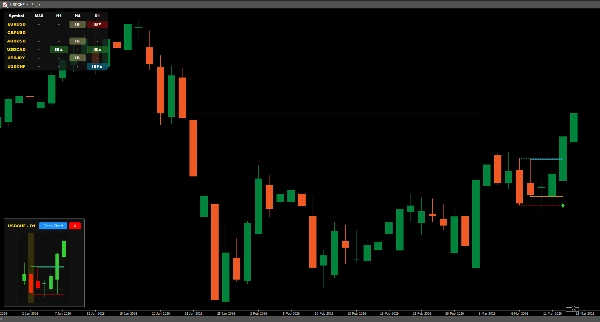
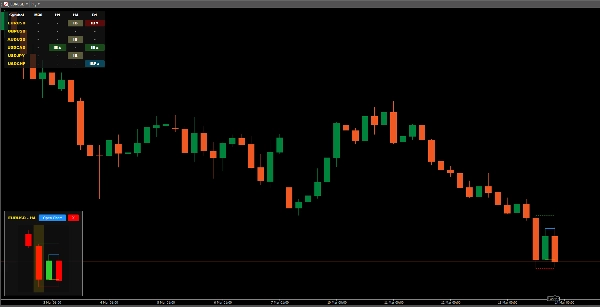
- All-in-One Dashboard: Überwachen Sie Dutzende von Paaren und Zeitrahmen über ein einziges, elegantes Raster.
- Genaues Erkennen von Ausbrüchen: Erhalten Sie sofortige Benachrichtigungen, wenn der Preis eine Inside Bar oder Mother Bar durchbricht, inklusive Fakeout-Erkennung.
- Intelligentes Mini-Chart Popup: Klicken Sie, um sofort ein Miniaturdiagramm des Signals anzuzeigen und sparen Sie wertvolle Analysezeit.
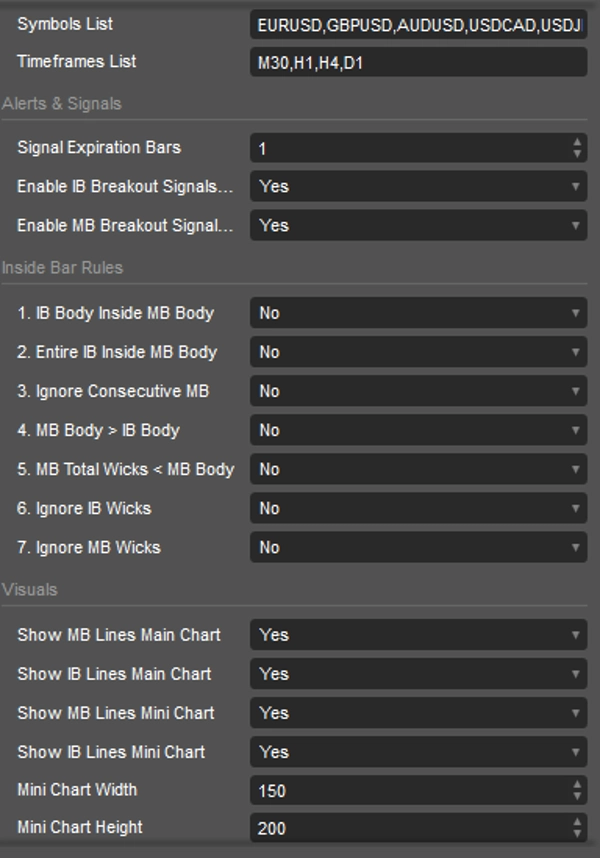
3. Setup-Anleitung & Parameterübersicht
Dieser Indikator ist zu 100 % auf Ihre Strategie zugeschnitten. So können Sie Ihre ultimative Scanning-Maschine feinjustieren:
- Allgemeine Einstellungen:
-
- Symbolliste: Geben Sie Ihre Zielwährungspaare ein (z. B. EURUSD, GBPUSD, AUDUSD), getrennt durch Kommas. Scannen Sie alle gleichzeitig!
- Zeitrahmenliste: Definieren Sie Ihren Ansatz, indem Sie Ihre bevorzugten Zeitrahmen eingeben (z. B. H1, H4, D1). Unterstützt alles von M1 für Scalper bis MN1 für langfristige Swing-Trader.
- Alarme & Signale:
-
- Signalablauf-Bars: Legen Sie fest, wie viele Bars ein Ausbruchssignal gültig bleibt (Standard: 1). Verhindern Sie späte Einstiege, wenn der Momentum weg ist!
- IB-Ausbruchssignale aktivieren (IBI/IBIF): Schalten Sie dies ein, um Benachrichtigungen zu erhalten, wenn der Preis die Grenzen der Inside Bar durchbricht (inklusive Fakeout-Erkennung).
- MB-Ausbruchssignale aktivieren (IB/IBF): Aktivieren Sie Alarme für echte Mother Bar-Ausbrüche – eine starke Bestätigung für Trendfortsetzung oder Umkehr.
- Intelligente Inside Bar Regeln:
-
- IB-Körper innerhalb MB-Körper: Strenger Filter, der verlangt, dass der Körper der Inside Bar vollständig im Körper der Mother Bar enthalten ist.
- Gesamte IB innerhalb MB-Körper: Die ultimative strenge Regel – die gesamte Inside Bar (inklusive Dochte) muss in den Körper der Mother Bar passen.
- Aufeinanderfolgende MB ignorieren: Überspringt aufeinanderfolgende Mother Bars, damit Sie sich nur auf frische, initiale Ausbruch-Setups konzentrieren können.
- MB-Körper > IB-Körper: Stellt sicher, dass der Körper der Mother Bar größer ist als der der Inside Bar und filtert schwache Formationen heraus.
- Gesamte MB-Dochte < MB-Körper: Filtert unordentliche Mother Bars heraus, indem sichergestellt wird, dass die Gesamtdochtlänge kleiner als der Körper ist. Verabschieden Sie sich vom Marktrauschen!
- IB/MB-Dochte ignorieren: Erzwingt, dass der Scanner Ausbrüche ausschließlich basierend auf den Open/Close-Preisen der Kerzen berechnet und nicht auf High/Low-Dochten.
- Visualisierung:
-
- MB/IB Linien im Hauptchart anzeigen: Zeichnet automatisch saubere Begrenzungslinien für MBs und IBs direkt in Ihrem Hauptchart.
- Mini-Chart Einstellungen: Schalten Sie Begrenzungslinien in Ihrem Popup-Mini-Chart ein und passen Sie Breite/Höhe perfekt an Ihren Bildschirm an.
4. Dashboard-Symbolübersicht: Den Markt auf einen Blick lesen
Das HIOInsideBarScanner-Dashboard verwendet intuitive Symbole, die Ihnen helfen, die aktuelle Kursbewegung sofort zu erfassen:
- IB: Eine neue Inside Bar hat sich gebildet. (Bereiten Sie sich auf einen möglichen Ausbruch vor!)
- IBI▲: Der Preis hat über dem Hoch der Inside Bar geschlossen. (Früher bullischer Ausbruch)
- IBI▼: Der Preis hat unter dem Tief der Inside Bar geschlossen. (Früher bärischer Ausbruch)
- IBIF▲: Der Preis durchbrach das Tief der Mother Bar, drehte dann um und schloss über dem Hoch der Inside Bar. (Bärischer Fakeout – Große Kaufgelegenheit)
- IBIF▼: Der Preis durchbrach das Hoch der Mother Bar, drehte dann um und schloss unter dem Tief der Inside Bar. (Bullischer Fakeout – Große Verkaufsgelegenheit)
- IB▲: Der Preis hat über dem Hoch der Mother Bar geschlossen. (Starke Bestätigung eines bullischen Ausbruchs)
- IB▼: Der Preis hat unter dem Tief der Mother Bar geschlossen. (Starke Bestätigung eines bärischen Ausbruchs)
- IBF▲: Der Preis durchbrach das Tief der Mother Bar, drehte dann heftig um und schloss über dem Hoch der Mother Bar. (Große Bärenfalle)
- IBF▼: Der Preis durchbrach das Hoch der Mother Bar, drehte dann heftig um und schloss unter dem Tief der Mother Bar. (Große Bullenfalle)
Zusammenfassung
Key functionalities include real-time alerts for breakouts of Inside Bars and Mother Bars, with built-in fakeout detection to enhance signal reliability. Users can customize symbol and timeframe lists, set signal expiration periods, and toggle specific breakout alerts. The indicator applies strict filtering rules based on candle body and wick relationships to refine pattern recognition and reduce noise.
A smart mini-chart popup allows quick visual analysis of signals without switching charts. Visual boundary lines for Inside Bars and Mother Bars can be displayed on the main chart and mini-chart for clarity. The dashboard uses intuitive symbols to convey the status of price action, such as new Inside Bars, bullish or bearish breakouts, and fakeout scenarios.
This tool supports a range of trading styles from scalping to long-term strategies by accommodating timeframes from one minute to monthly charts. It is adaptable to user strategies through detailed parameter settings, facilitating tailored market scanning and breakout detection.
Kundenbewertungen
5 | 100 % | |
4 | 0 % | |
3 | 0 % | |
2 | 0 % | |
1 | 0 % |


