
Opis
Witamy w Economic Calendar ChartAlert!
Zmęczony ciągłym przełączaniem się między platformą handlową a przeglądarką internetową, aby sprawdzać wiadomości? Economic Calendar ChartAlert przenosi globalny harmonogram ekonomiczny bezpośrednio na Twoje wykresy cTrader. Zaprojektowany zarówno dla day traderów, jak i swing traderów, ten wskaźnik zapewnia, że nigdy nie zostaniesz zaskoczony przez nagłe skoki wywołane ważnymi wiadomościami.
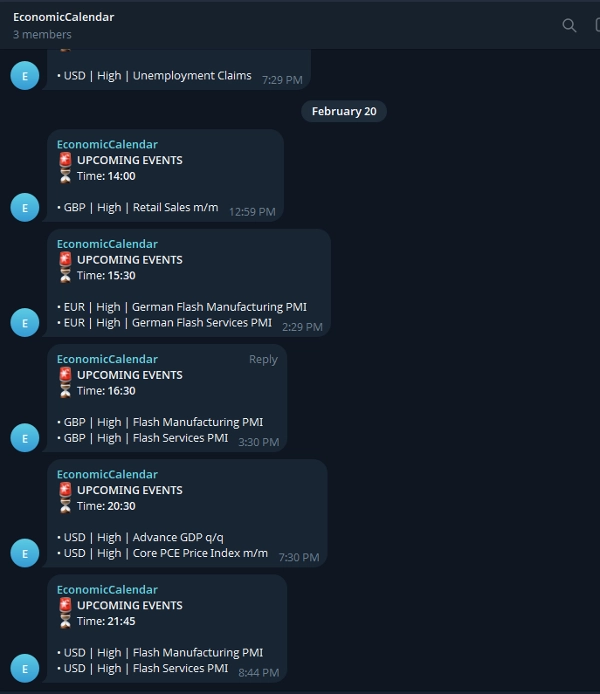
Nie tylko elegancko wyświetla nadchodzące wydarzenia na ekranie, ale także posiada wbudowaną integrację z Telegramem, która wysyła powiadomienie na Twój telefon/komputer dokładnie 1 godzinę przed kluczowymi wydarzeniami.
Kluczowe funkcje:
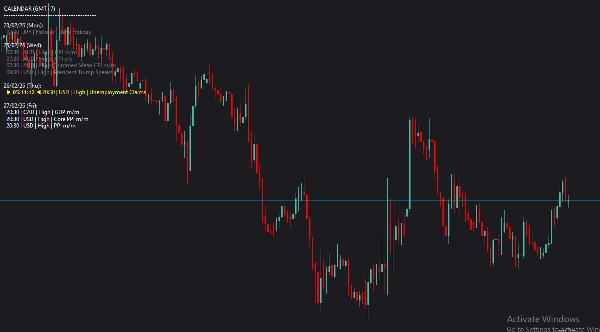
- 📊 Nakładka na wykresie: Czysty, nowoczesny i nieinwazyjny wyświetlacz tekstu z użyciem czcionki Roboto.
- 🔔 Automatyczne alerty Telegram: Otrzymuj powiadomienia na czacie osobistym lub grupowym przed pojawieniem się wiadomości.
- 🎯 Inteligentne filtrowanie: Widoczność tylko tych wiadomości, które mają znaczenie dla Twojej strategii. Filtruj według konkretnych walut lub poziomów wpływu.
- 🎨 Wizualne kodowanie kolorami: Natychmiast rozpoznawaj przeszłe wydarzenia, najbliższe nadchodzące wydarzenie (wyróżnione) oraz przyszłe wydarzenia.
⚙️ Przewodnik konfiguracji i wyjaśnienia parametrów
Po dodaniu wskaźnika do wykresu możesz dostosować następujące parametry, aby dopasować go do swojego stylu handlu:
Ustawienia wizualne:
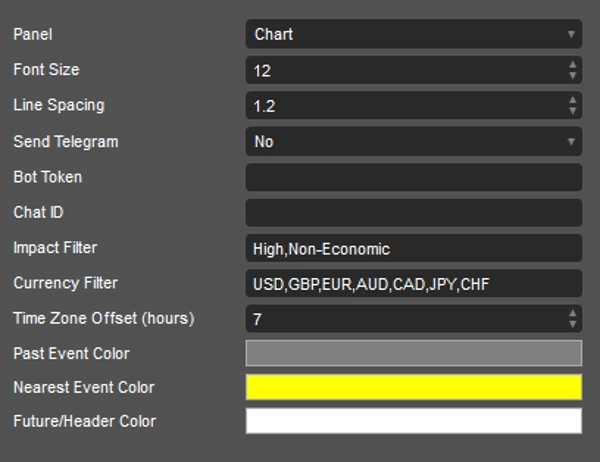
- Rozmiar czcionki i odstępy między liniami: Dostosuj rozmiar i odstępy tekstu, aby wyglądał idealnie na rozdzielczości Twojego monitora.
Ustawienia Telegram:
- Wysyłaj Telegram: Przełącz na
Yesjeśli chcesz otrzymywać alerty. (Alerty są wysyłane około 1 godzinę przed wydarzeniem). - Token bota: Wklej token HTTP API swojego bota Telegram (utworzonego przez BotFather).
- ID czatu: Wprowadź swoje osobiste ID czatu lub ID grupy/kanalu Telegram, do którego chcesz wysyłać alerty.
Ustawienia filtrów (kluczowe dla czystego wykresu):
- Filtr wpływu: Wpisz dokładne poziomy wpływu, które chcesz widzieć, oddzielone przecinkami (Domyślnie:
High,Non-Economic). UżyjAll, aby pokazać wszystko. - Filtr walut: Określ, które waluty handlujesz (Domyślnie:
USD,GBP,EUR,AUD,CAD,JPY,CHF). UżyjAlldla wszystkich walut. - Przesunięcie strefy czasowej (godziny): Dostosuj to, aby dopasować do swojej lokalnej strefy czasowej. Na przykład użyj
7dla GMT+7.
Kolory:
- Kolor przeszłych wydarzeń: Kolor dla wydarzeń, które już miały miejsce dzisiaj (Domyślnie: Szary).
- Kolor najbliższego wydarzenia: Wyróżnia najbliższe nadchodzące wydarzenie, aby przyciągnąć Twoją uwagę (Domyślnie: Żółty).
- Kolor przyszłych/w nagłówkach: Kolor nagłówków kalendarza i nadchodzących wydarzeń (Domyślnie: Biały).
Handluj mądrze, bądź na bieżąco i pozwól, aby wykresy pracowały za Ciebie!
Podsumowanie
The indicator features automated Telegram alerts, sending notifications approximately one hour before high-impact events to personal chats or groups via a configurable Telegram Bot. Visual settings allow adjustment of font size and line spacing for optimal display on various monitors. Time zone offset can be set to match local time.
Key functionalities include on-chart event display, smart filtering by currency and impact, color-coded event visualization, and Telegram integration for timely alerts. Supported markets and symbols include Forex, indices, commodities, and cryptocurrencies such as BTCUSD, EURUSD, GBPUSD, USDJPY, and XAUUSD. This tool aids traders in staying informed of critical economic news without leaving their trading platform.
Opinie klientów
5 | 100 % | |
4 | 0 % | |
3 | 0 % | |
2 | 0 % | |
1 | 0 % |


![Logo „High-Low Divergence [Iridio Capital]”](https://cdn.ctrader.com/image/webp/443c4661-7abb-40f1-842f-4b6ec560649b_40914)


