![Trading product for [Stellar Strategies] Visual Trend Momentum Indicatore Signal Commodities, image 1](https://cdn.ctrader.com/image/webp/48aee0a5-f10e-4bc8-9671-78e156fcc5df_27548)
![Trading product for [Stellar Strategies] Visual Trend Momentum Indicatore Signal Commodities, image 2](https://cdn.ctrader.com/image/webp/bf3e8d6e-4fe2-498f-9c94-fcc41b457306_27549)
![Trading product for [Stellar Strategies] Visual Trend Momentum Indicatore Signal Commodities, image 3](https://cdn.ctrader.com/image/webp/606e7147-24a3-4137-b2c8-1245a4fbb93a_27550)
![Trading product for [Stellar Strategies] Visual Trend Momentum Indicatore Signal Commodities, image 4](https://cdn.ctrader.com/image/webp/c6f6508a-0abf-4df2-a2ec-8954c481ec9e_27551)
![Trading product for [Stellar Strategies] Visual Trend Momentum Indicatore Signal Commodities, image 5](https://cdn.ctrader.com/image/webp/f59e757b-aaa5-46aa-b41b-b5852db0a3ae_27552)
![Trading product for [Stellar Strategies] Visual Trend Momentum Indicatore Signal Commodities, image 6](https://cdn.ctrader.com/image/webp/60e2a71a-ca6f-467f-a22f-fd4a31226ef6_27553)
Descrizione
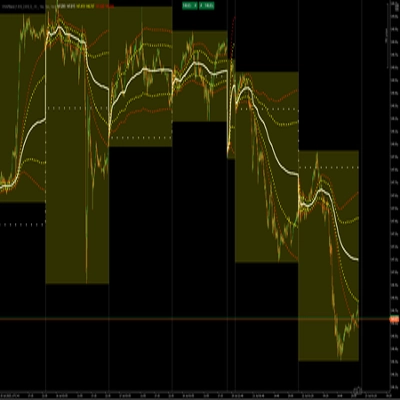
Questo indicatore cAlgo, chiamato VisualTrendMomentum, è progettato per rappresentare visivamente la forza e il momentum del trend su un grafico utilizzando una combinazione di medie mobili (MA), Average True Range (ATR) e analisi del volume. Mira a fornire ai trader un'indicazione visiva chiara di potenziali segnali di acquisto e vendita, nonché di cambiamenti di trend, attraverso icone a diamante colorate e frecce.
Caratteristiche principali:
- Rilevamento del trend:
-
- Utilizza tre medie mobili esponenziali (veloce, media e lenta) per determinare la direzione generale del trend.
- Differenzia tra segnali di acquisto/vendita "forti" e "deboli" basandosi sull'allineamento di queste MA e sui prezzi di chiusura e apertura della barra corrente.
- Analisi della volatilità:
-
- Incorpora tre indicatori ATR (breve, medio e lungo) per misurare la volatilità del mercato.
- Utilizza i livelli di volatilità per filtrare e rafforzare i segnali di acquisto/vendita.
- Conferma del volume:
-
- Analizza il volume tick per identificare picchi di volume significativi, che possono confermare la forza del trend.
- Utilizza un moltiplicatore per impostare il livello di volume significativo.
- Rilevamento del cambiamento di trend:
-
- Rileva i cambiamenti di trend confrontando lo stato attuale di forte acquisto/vendita con lo stato precedente.
- I cambiamenti di trend sono evidenziati da una freccia verso l'alto o verso il basso.
- Rappresentazione visiva:
-
- Visualizza i segnali di acquisto/vendita utilizzando icone a diamante colorate sul grafico, con colori diversi che indicano la forza del segnale (forte vs. debole).
- I cambiamenti di trend sono mostrati usando frecce verso l'alto o verso il basso.
- Il colore delle icone e delle frecce è personalizzabile tramite i parametri dell'indicatore.
- Parametri personalizzabili:
-
- L'indicatore consente agli utenti di personalizzare i periodi per le medie mobili e gli ATR, il moltiplicatore del volume e i colori utilizzati per la visualizzazione.
Come utilizzare l'indicatore:
- Aggiungi l'indicatore a cAlgo:
-
- Apri un grafico in cAlgo.
- Aggiungi l'indicatore [Stellar Strategies]
VisualTrendMomentumal grafico dalla lista "Indicators".
- Configura i parametri:
-
- Regola i parametri di input in base al tuo stile di trading e al mercato specifico che stai analizzando.
-
Fast MA Period,Medium MA Period,Slow MA Period: Imposta i periodi per le medie mobili esponenziali.Short ATR Period,Medium ATR Period,Long ATR Period: Imposta i periodi per gli indicatori average true range.Significant Volume Multiplier: Regola il moltiplicatore per definire i livelli di volume significativo.Strong Buy Color,Strong Sell Color,Weak Buy Color,Weak Sell Color,Trend Change Color: Scegli i colori per i diversi tipi di segnale.
- Interpreta i segnali:
-
- Diamanti colorati:
-
- Diamanti verde scuro: segnali di acquisto forti.
- Diamanti rosso scuro: segnali di vendita forti.
- Diamanti oliva: segnali di acquisto deboli.
- Diamanti marroni: segnali di vendita deboli.
- Frecce:
-
- Freccia dorata verso l'alto: indicazione di un cambiamento di trend da vendita ad acquisto.
- Freccia dorata verso il basso: indicazione di un cambiamento di trend da acquisto a vendita.
- Forza del trend:
-
- La combinazione di icone a diamante e livelli di volume fornisce un'idea della forza del trend attuale. Un volume più alto con un diamante di acquisto/vendita forte rafforza il segnale.
- Decisioni di trading:
-
- Usa i segnali dell'indicatore insieme ad altri strumenti di analisi tecnica e alla tua strategia di trading.
- Considera il contesto generale del mercato e la gestione del rischio prima di prendere qualsiasi decisione di trading.
- Note importanti:
-
- Poiché l'indicatore utilizza medie mobili e indicatori ATR, è un indicatore ritardato.
- L'indicatore è più efficace nei mercati in trend.
- Regola i parametri per adattarli alle condizioni di mercato.
................................................................................................................................................................................................................
Avvertenza per i trader: Il trading comporta rischi significativi e non è adatto a tutti gli investitori. Potresti perdere parte o tutto il capitale investito. Assicurati sempre di comprendere appieno i rischi e di cercare consulenza finanziaria indipendente se necessario. L'indicatore Visual Trend Momentum è uno strumento per aiutare a identificare trend e potenziali opportunità di trading, ma non garantisce operazioni redditizie.
Riepilogo
Recensioni dei clienti
5 | 100 % | |
4 | 0 % | |
3 | 0 % | |
2 | 0 % | |
1 | 0 % |
![Logo di "[Stellar Strategies] Market Structure Breakout"](https://cdn.ctrader.com/image/webp/bceec265-3247-4b11-915f-6295a29c106d_28465)
![Logo di "[Stellar Strategies] Market Session Ultimate"](https://cdn.ctrader.com/image/webp/61ffd537-0125-4246-9e72-42eca1791d64_28232)
![Logo di "[Stellar Strategies] BOS Trend 1.0"](https://cdn.ctrader.com/image/webp/6cdec0f1-0e97-4a82-a8a4-2b67aed54d38_25695)
![Logo di "[Stellar Strategies] Inside Bar with Signals"](https://cdn.ctrader.com/image/webp/1d9e8bfa-3b2c-4440-bb37-5856902008a7_30683)
![Logo di "[Stellar Strategies] Wave Trend Pro"](https://cdn.ctrader.com/image/webp/5f226fbb-245a-41cd-9cdd-b018257d5e6d_28617)
![Logo di "[Stellar Strategies] Smart ADX"](https://cdn.ctrader.com/image/webp/af13b084-b6f6-41db-b7bc-c7e688b57b05_36929)
![Logo di "[Stellar Strategies] Linear Regression Candles 1.1"](https://cdn.ctrader.com/image/webp/8b9cff9f-2431-46d2-b0ec-c7f55f4a4a6d_27918)
![Logo di "[Stellar Strategies] VBO"](https://cdn.ctrader.com/image/webp/f034c012-94d4-445a-a01b-febd1cdedaef_36944)
![Logo di "[StellarStrategies] Scheduled Trade Executor"](https://cdn.ctrader.com/image/webp/daefc6af-7eca-453e-878d-1b981be2c401_25646)
![Logo di "[Stellar Strategies] Candlestick Patterns Dashboard"](https://cdn.ctrader.com/image/webp/ae8691a5-4884-4553-9bcc-64e16ac82a30_38344)
![Logo di "[Stellar Strategies] SP500 Gap Closure cBot 1.0"](https://cdn.ctrader.com/image/webp/92c23fdc-4ad1-4e61-bdb5-c77f6ec8c539_27686)
![Logo di "[Stellar Strategies] QQE"](https://cdn.ctrader.com/image/webp/e702104a-874c-4b39-97dd-fb34518d1015_27712)

![Logo di "[Hamster-Coder] Bollinger Bands"](https://cdn.ctrader.com/image/webp/21d8e5d6-fb11-4bac-b9ee-cd05c2b76804_30327)