![Trading product for [Stellar Strategies] QQE Indicatore Signal Indices, image 1](https://cdn.ctrader.com/image/webp/e702104a-874c-4b39-97dd-fb34518d1015_27712)
[Stellar Strategies] QQE
Indicatore
285 download
Versione 1.0, Mar 2025
Windows, Mac
5.0
Recensioni: 1
![Trading product for [Stellar Strategies] QQE Indicatore Signal Indices, image 2](https://cdn.ctrader.com/image/webp/76b980a3-76bf-4305-a55c-72c65f217667_27713)
![Trading product for [Stellar Strategies] QQE Indicatore Signal Indices, image 3](https://cdn.ctrader.com/image/webp/a8dedc4d-2393-4b97-b251-c5273f061551_27714)
![Trading product for [Stellar Strategies] QQE Indicatore Signal Indices, image 4](https://cdn.ctrader.com/image/webp/33002ac3-dd6b-41b0-9a74-e19f836dc126_27715)
![Trading product for [Stellar Strategies] QQE Indicatore Signal Indices, image 5](https://cdn.ctrader.com/image/webp/2c4dce8e-c324-473b-983c-c75286fa4d8e_27716)
![Trading product for [Stellar Strategies] QQE Indicatore Signal Indices, image 6](https://cdn.ctrader.com/image/webp/d6366ad6-6070-4de9-ac26-44e98acd02c2_27717)
Descrizione
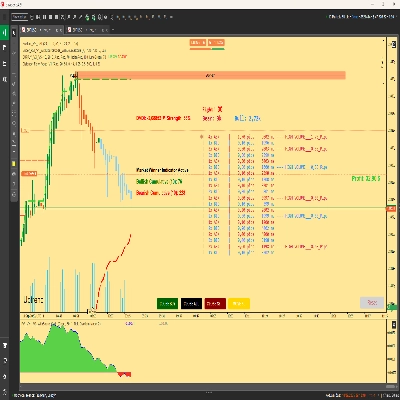
L'indicatore Quantitative Qualitative Estimation (QQE) è uno strumento di analisi tecnica progettato per identificare potenziali cambiamenti di tendenza e segnali di trading. Questa implementazione cAlgo dell'indicatore QQE incorpora le seguenti caratteristiche:
- Calcolo basato su doppio RSI: Utilizza due calcoli dell'Indice di Forza Relativa (RSI) con periodi e fattori di smussamento regolabili.
- Bande di Bollinger: Le Bande di Bollinger sono applicate ai valori RSI smussati per definire i livelli di ipercomprato e ipervenduto.
- Output a istogramma e linea: L'indicatore fornisce sia un istogramma che un output a linea, permettendo ai trader di visualizzare il momentum del mercato e potenziali inversioni di tendenza.
- Istogramma codificato a colori: L'istogramma è codificato a colori, mostrando valori positivi (che indicano momentum rialzista) in blu e valori negativi (che indicano momentum ribassista) in rosso.
- Linea zero: Una linea bianca tratteggiata è tracciata a zero per un facile riferimento.
- Parametri regolabili: L'indicatore offre vari parametri regolabili, permettendo ai trader di personalizzarlo in base al proprio stile di trading e alle condizioni di mercato.
Come usare l'indicatore QQE:
- Allega l'indicatore al tuo grafico:
-
- In cAlgo, apri il grafico dello strumento che vuoi analizzare.
- Trascina e rilascia l'indicatore "QQE" dal pannello "Indicators" sul tuo grafico.
- Configura i parametri dell'indicatore:
-
- Dopo aver allegato l'indicatore, apparirà una finestra "Parameters".
- Regola i seguenti parametri secondo necessità:
-
- Periodo RSI: Il periodo usato per il primo calcolo RSI.
- Smussamento RSI: Il fattore di smussamento applicato al primo RSI.
- Fattore QQE: Il fattore usato per calcolare le Bande di Bollinger.
- Lunghezza Bollinger: La lunghezza delle Bande di Bollinger.
- Moltiplicatore Bollinger: Il moltiplicatore usato per le Bande di Bollinger.
- Periodo RSI2: Il periodo usato per il secondo calcolo RSI.
- Smussamento RSI2: Il fattore di smussamento applicato al secondo RSI.
- Fattore QQE2: Il fattore usato per calcolare il secondo set di bande.
- Soglia: Il valore della soglia che aiuta a determinare la forza del segnale.
- Interpreta l'indicatore:
-
- Istogramma:
-
- Le barre blu indicano momentum rialzista.
- Le barre rosse indicano momentum ribassista.
- L'altezza delle barre rappresenta la forza del momentum.
- Linea QQE: La linea nera rappresenta il valore di
RSI2-50, e fornisce una rappresentazione smussata del momentum. - Linea zero: La linea bianca tratteggiata rappresenta il livello zero.
- Bande di Bollinger:
-
- Quando la linea RSI1 attraversa la Banda di Bollinger superiore, può indicare una condizione di ipercomprato e una potenziale inversione.
- Quando la linea RSI1 attraversa la Banda di Bollinger inferiore, può indicare una condizione di ipervenduto e una potenziale inversione.
- Segnali di trading:
-
- Segnale di acquisto: Cerca barre blu nell'istogramma sopra la linea zero, indicando momentum rialzista.
- Segnale di vendita: Cerca barre rosse nell'istogramma sotto la linea zero, indicando momentum ribassista.
- Usa le Bande di Bollinger e i crossover della linea RSI per confermare i segnali.
- Combina con altri indicatori:
-
- Per segnali più affidabili, combina l'indicatore QQE con altri strumenti di analisi tecnica, come linee di tendenza, livelli di supporto e resistenza, e altri indicatori.
- Pratica e backtesting:
-
- Prima di usare l'indicatore QQE nel trading reale, esercitati utilizzandolo in un conto demo e testalo su dati storici.
Note importanti:
- L'indicatore QQE non è un sistema infallibile e non dovrebbe essere usato in isolamento.
- Usa sempre tecniche di gestione del rischio adeguate quando fai trading.
- Le condizioni di mercato possono cambiare rapidamente, quindi sii pronto ad adattare la tua strategia di trading.
Seguendo queste linee guida, puoi usare efficacemente l'indicatore QQE per identificare potenziali opportunità di trading e prendere decisioni di trading informate.
Riepilogo
Profilo indicatore
Recensioni dei clienti
5.0
Recensioni: 1
5 | 100 % | |
4 | 0 % | |
3 | 0 % | |
2 | 0 % | |
1 | 0 % |
Recensioni dei clienti
August 18, 2025
Reliable RSI-based oscillator, smooth signals, customizable. Cons: No alerts, no MTF mode, lacks strategy templates.
Discussioni
Domande frequenti
Signal
Indices
RSI
Bollinger
I prodotti disponibili tramite cTrader Store, inclusi bot di trading, indicatori e plugin, sono forniti da sviluppatori terzi e resi disponibili esclusivamente a scopo informativo e di accesso tecnico. cTrader Store non è un broker e non fornisce consulenze in materia di investimento, raccomandazioni individualizzate o garanzie di risultati futuri.
Altro da questo autore
![Logo di "[Stellar Strategies] Market Structure Breakout"](https://cdn.ctrader.com/image/webp/bceec265-3247-4b11-915f-6295a29c106d_28465)
![Logo di "[Stellar Strategies] Market Session Ultimate"](https://cdn.ctrader.com/image/webp/61ffd537-0125-4246-9e72-42eca1791d64_28232)
![Logo di "[Stellar Strategies] BOS Trend 1.0"](https://cdn.ctrader.com/image/webp/6cdec0f1-0e97-4a82-a8a4-2b67aed54d38_25695)
![Logo di "[Stellar Strategies] Inside Bar with Signals"](https://cdn.ctrader.com/image/webp/1d9e8bfa-3b2c-4440-bb37-5856902008a7_30683)
![Logo di "[Stellar Strategies] Wave Trend Pro"](https://cdn.ctrader.com/image/webp/5f226fbb-245a-41cd-9cdd-b018257d5e6d_28617)
![Logo di "[Stellar Strategies] Smart ADX"](https://cdn.ctrader.com/image/webp/af13b084-b6f6-41db-b7bc-c7e688b57b05_36929)
![Logo di "[Stellar Strategies] Linear Regression Candles 1.1"](https://cdn.ctrader.com/image/webp/8b9cff9f-2431-46d2-b0ec-c7f55f4a4a6d_27918)
![Logo di "[Stellar Strategies] VBO"](https://cdn.ctrader.com/image/webp/f034c012-94d4-445a-a01b-febd1cdedaef_36944)
![Logo di "[StellarStrategies] Scheduled Trade Executor"](https://cdn.ctrader.com/image/webp/daefc6af-7eca-453e-878d-1b981be2c401_25646)
![Logo di "[Stellar Strategies] Candlestick Patterns Dashboard"](https://cdn.ctrader.com/image/webp/ae8691a5-4884-4553-9bcc-64e16ac82a30_38344)
![Logo di "[Stellar Strategies] SP500 Gap Closure cBot 1.0"](https://cdn.ctrader.com/image/webp/92c23fdc-4ad1-4e61-bdb5-c77f6ec8c539_27686)
![Logo di "[Stellar Strategies] Visual Trend Momentum"](https://cdn.ctrader.com/image/webp/48aee0a5-f10e-4bc8-9671-78e156fcc5df_27548)


Prezzo
20.46M
Volume negoziato
8K
Profitto in pip
25
Vendite
4.34K
Installazioni gratuite