
Descrizione
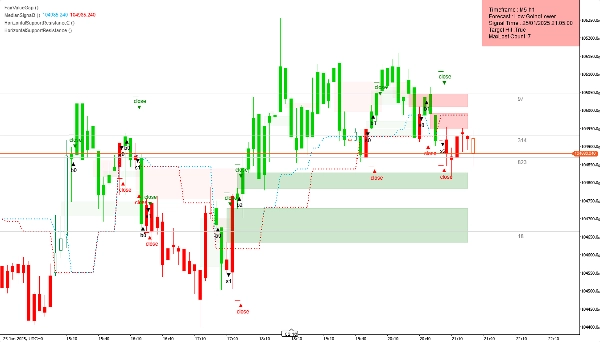
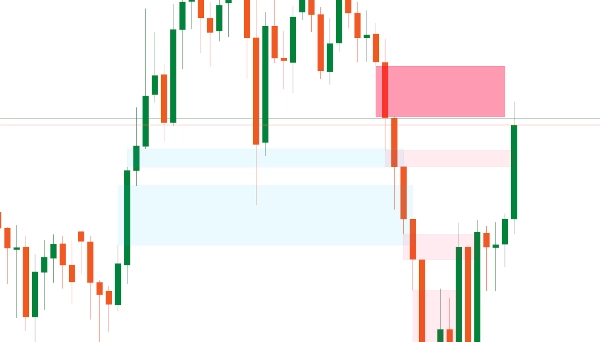
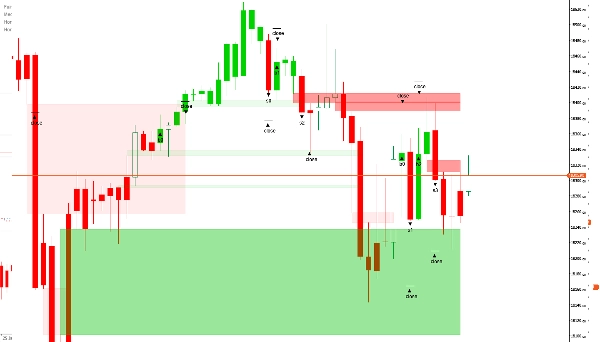
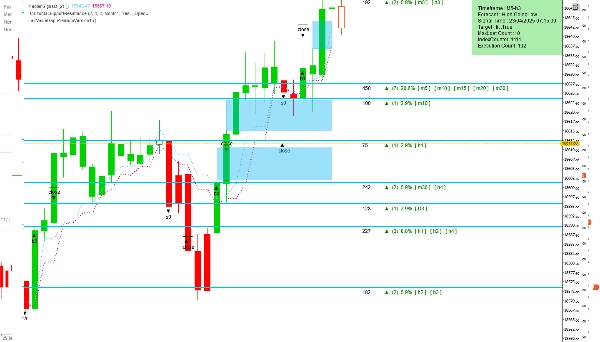
L'indicatore Fair Value Gap (FVG) è uno strumento di analisi tecnica progettato per individuare potenziali squilibri di prezzo nel mercato. Questi gap si verificano quando il prezzo si muove rapidamente, creando una zona con attività di trading minima—spesso definita come un "vuoto". Tali squilibri possono indicare una probabilità di ritracciamento del prezzo, poiché il mercato tende a cercare l'equilibrio rivisitando queste aree.
Panoramica delle Impostazioni
- Barre da Caricare: Specifica il numero di barre storiche da analizzare, partendo da quella più recentemente completata e procedendo a ritroso.
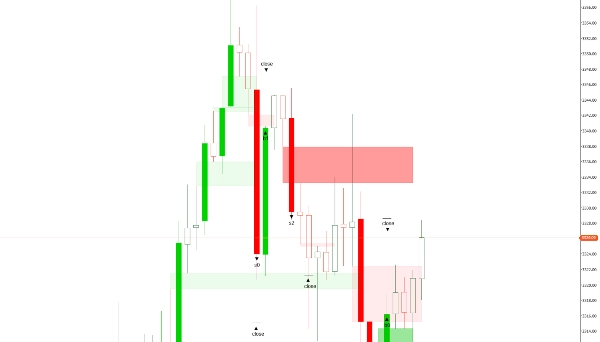
- Colore FVG Rialzista: Imposta il colore per gli FVG che appaiono in un trend rialzista. Viene applicata una trasparenza del 30% in modo che gli elementi dietro il gap rimangano visibili.
- Colore FVG Ribassista: Imposta il colore per gli FVG che appaiono in un trend ribassista, anch'esso con una trasparenza del 30% per una migliore visibilità del grafico.
Funzionalità Premium (Disponibili nella Versione a Pagamento)
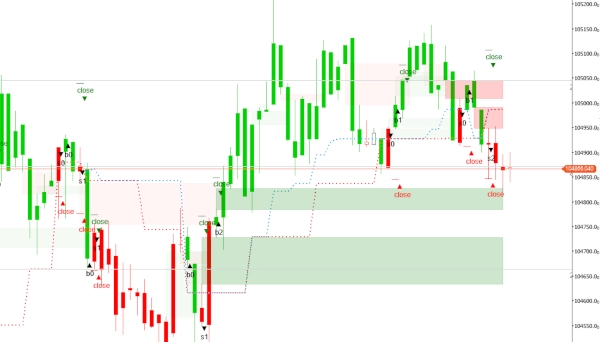
- Elimina Gap Chiusi: Un'impostazione booleana—quando abilitata ("sì"), rimuove automaticamente tutti i gap chiusi; se disabilitata ("no"), i gap rimangono visibili. Questo è particolarmente utile su timeframe inferiori a 20 minuti.
- Modifica/Rimuovi Gap: Permette ai trader di regolare o eliminare manualmente i gap. Questo offre ai trader esperti un maggiore controllo, soprattutto perché i gap molto piccoli solitamente hanno poca influenza sul movimento del prezzo.
- Imposta Timeframe: Offre due opzioni—utilizzare il timeframe del grafico corrente o selezionarne uno diverso per l'analisi, mostrando comunque i risultati sul grafico principale. Questa funzione aiuta i trader a ottenere rapidamente informazioni sui probabili movimenti di mercato.
- Timeframe Selezionato: Specifica il timeframe desiderato per l'analisi se è stata scelta l'opzione "Timeframe Selezionato" nell'impostazione sopra.
- Precisione per Gap Piccoli: Permette ai trader di inserire una dimensione preferita del gap come numero intero, aiutandoli a identificare gap che storicamente portano a risultati favorevoli. Il valore si basa sull'intero set di dati e sulle dimensioni dei gap osservate per l'asset.
Per impostazione predefinita, l'indicatore analizza tutti gli squilibri all'interno di un singolo timeframe. Tuttavia, l'accesso alle funzionalità premium tramite la FairValueGapPremium versione può migliorare notevolmente le capacità analitiche.
Riepilogo
Key settings include:
- Bars To Load: number of historical bars analyzed from the most recent backward.
- Bullish FVG Color: customizable color for gaps in uptrends with 30% transparency.
- Bearish FVG Color: customizable color for gaps in downtrends with 30% transparency.
Premium features (available in the paid version) enhance functionality by allowing:
- Automatic deletion of closed gaps, useful for lower timeframes.
- Manual editing or removal of gaps for finer control.
- Selection of analysis timeframe independent of the chart’s timeframe.
- Input of preferred gap size to improve identification accuracy based on historical data.
By default, the indicator scans imbalances within a single timeframe, with premium options providing expanded analytical capabilities.
Recensioni dei clienti
5 | 50 % | |
4 | 50 % | |
3 | 0 % | |
2 | 0 % | |
1 | 0 % |


