
KeyLevels
Indicatore
328 download
Versione 1.0, Nov 2025
Windows, Mac
Descrizione
Panoramica
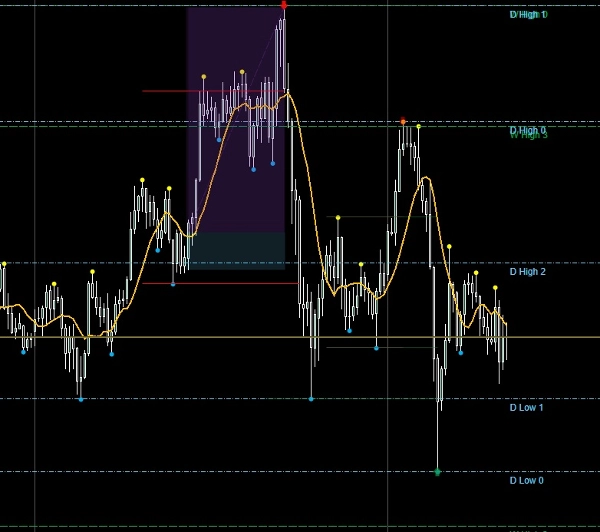
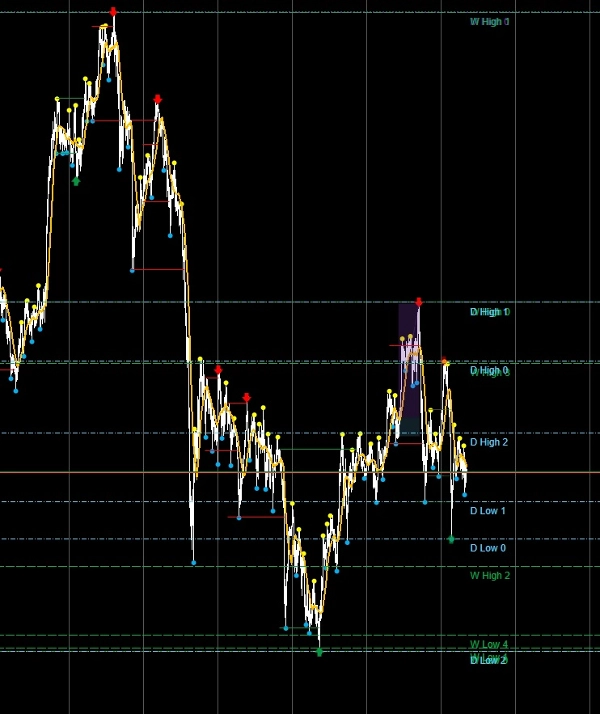
Il Key Levels Indicator è progettato per i trader che si affidano ad ancore di timeframe superiori per guidare l'esecuzione intraday. Identifica automaticamente e traccia linee orizzontali per massimi e minimi mensili, settimanali e giornalieri, offrendo una consapevolezza strutturale immediata su più timeframe. Ogni livello è completamente personalizzabile, così puoi adattare la visualizzazione al tuo playbook e al tuo flusso di lavoro.
Caratteristiche principali
- 🔹 Livelli Multi-Timeframe – Traccia massimi e minimi da barre mensili, settimanali e giornaliere.
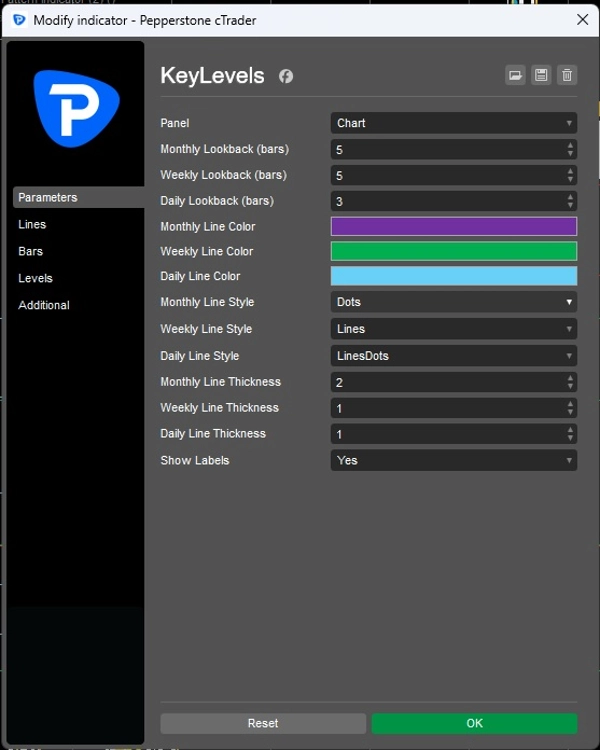
- 🔹 Periodi di Lookback Personalizzati – Scegli quanti barre passate includere per ogni timeframe.
- 🔹 Personalizzazione Visiva – Imposta colori individuali, stili di linea e spessore per i livelli mensili, settimanali e giornalieri.
- 🔹 Opzione Etichette – Attiva/disattiva le etichette per una chiara identificazione di ogni livello.
- 🔹 Aggiornamenti Dinamici – I livelli si aggiornano automaticamente con la chiusura di nuove barre.
- 🔹 Integrazione Pulita nel Grafico – Le linee sono tracciate direttamente sul tuo grafico per un facile riferimento.
Vantaggi per i trader
- Ancoraggio delle tue configurazioni intraday a livelli oggettivi di timeframe superiori.
- Rafforza disciplina e filtri di convinzione mostrando solo i punti strutturali chiave.
- Risparmio di tempo automatizzando il tracciamento dei livelli — niente più disegni manuali.
- Migliora la chiarezza quando si combinano analisi su più timeframe.
Casi d'uso
- Gli scalper intraday possono allineare gli ingressi con livelli giornalieri o settimanali.
- I trader swing possono monitorare ancore mensili per configurazioni di continuazione.
- I trader guidati dal playbook possono integrare l'indicatore nella loro checklist unificata per una classificazione istantanea.
Riepilogo
Profilo indicatore
Recensioni dei clienti
0.0
Recensioni: 0
Recensioni dei clienti
Questo prodotto non ha ancora ricevuto recensioni. L'hai già provato? Fallo sapere agli altri per primo!
Discussioni
Domande frequenti
BTCUSD
Forex
Signal
Breakout
Indices
EURUSD
Commodities
GBPUSD
NZDUSD
Prop
Scalping
Crypto
Stocks
XAUUSD
NAS100
USDJPY
I prodotti disponibili tramite cTrader Store, inclusi bot di trading, indicatori e plugin, sono forniti da sviluppatori terzi e resi disponibili esclusivamente a scopo informativo e di accesso tecnico. cTrader Store non è un broker e non fornisce consulenze in materia di investimento, raccomandazioni individualizzate o garanzie di risultati futuri.
Altro da questo autore


![Logo di "[Stellar Strategies] Inside Bar with Signals"](https://cdn.ctrader.com/image/webp/1d9e8bfa-3b2c-4440-bb37-5856902008a7_30683)


Prezzo
Da 24/04/2025
168.09M
Volume negoziato
17.73K
Profitto in pip
11
Vendite
328
Installazioni gratuite