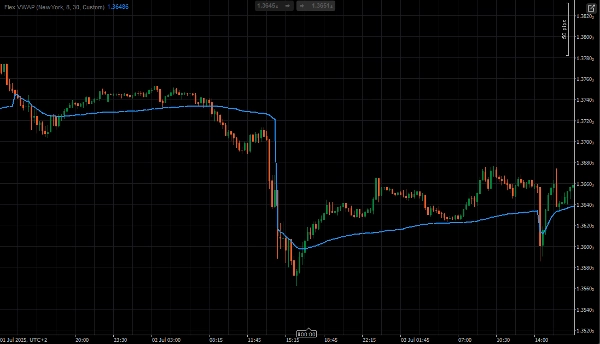
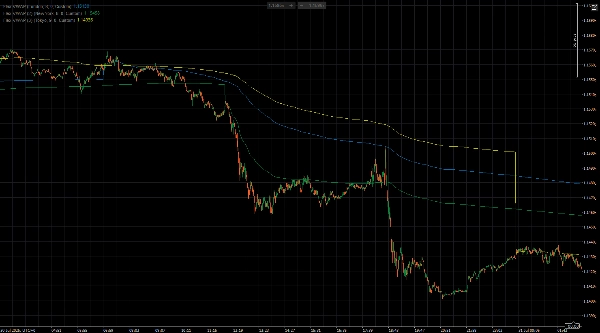
Broker e prop firm
Per le aziende
00
Days
:
00
Hours
:
00
Minutes
:
00
Seconds
Flex VWAP
Logo di "Flex VWAP"
Da 15/06/2025
Installazioni gratuite
353
Immagine caricata di "Flex VWAP"Immagine caricata di "Flex VWAP"

The Flex VWAP indicator provides a volume-weighted average price calculation with highly customizable reset periods including yearly, monthly, weekly, daily, hourly intervals, and custom time settings. It supports multiple timezone configurations (New York, London, Tokyo, Sydney, Local) allowing traders to align VWAP calculations with specific trading sessions. Users can set custom reset times down to the minute for precise session management and personalized trading strategies. The VWAP line updates in real-time using typical price methodology and provides a reliable reference for institutional trading levels and market bias analysis.

Forex Session Settings
==================

London Session
Base TimeZone: London
Custom Hour: 8
Custom Minute: 0
Reset Period: Custom

New York Session
Base TimeZone: NewYork
Custom Hour: 8
Custom Minute: 0
Reset Period: Custom

Tokyo Session
Base TimeZone: Tokyo
Custom Hour: 9
Custom Minute: 0
Reset Period: Custom


Stock Exchange Session Settings
==========================

London Session
Base TimeZone: London
Custom Hour: 8
Custom Minute: 0
Reset Period: Custom

New York Session
Base TimeZone: NewYork
Custom Hour: 9
Custom Minute: 30
Reset Period: Custom

Tokyo Session
Base TimeZone: Tokyo
Custom Hour: 9
Custom Minute: 0
Reset Period: Custom

5.0
Recensioni: 1
5
100 %
4
0 %
3
0 %
2
0 %
1
0 %
Recensioni dei clienti
July 14, 2025
Same as description, good parameters
Altro da questo autore
Simple MACD Histogram
Simple MACD Histogram with color-coded rising (green) and falling (red) momentum bars.
Potrebbe interessarti anche
Indicatore
Stocks
Forex
Crypto
+1
Market Structure SNR + Auto Bias
Market Structure Indicator – Your Trading Map in a Noisy Market. No more Panicking Which one, Where, Why and How.
Indicatore
Breakout
Fibonacci
Linear Regression Channel
Statistically-grounded trend channels via linear regression — clear trend & reversal zones.
Indicatore
NAS100
NZDUSD
XAUUSD
+11
HKTrading Free ZigZag
Lightweight ZigZag tool for clear structure, swing highs/lows and liquidity-based analysis.
Indicatore
Grid
NAS100
NZDUSD
+16
Frac Support Resistance V1
Smart Support/Resistance lines auto calculated from D1/H4/H1/M15. Highly customizable visuals + built in Backtest Mode.
Simple MACD Histogram
Simple MACD Histogram with color-coded rising (green) and falling (red) momentum bars.
Indicatore
Indices
Stocks
Commodities
+2
Market Sessions - Free
Track major trading sessions (Tokyo, London, New York) with customizable colors and visual sessions on your chart.
Indicatore
Grid
RSI
Breakout
+6
Final Stochastic Oscillator
Final Stochastic Oscillator is a next-generation upgrade of the classic stochastic indicator
Vice TrendTrading
Unlike most indicators that show signals blindly, this show valid entries inside TREND ZONES and visual trend BACKTESTS.
Indicatore
Forex
EURUSD
EconomicForex
ECONOMIC FOREX:provides insights into inflation, nominal interest rates and real interest rates, in the line chart
BLOCK LIQUIDITY PRO
Block Liquidity,indicator.Block Order, Liquids Stops, Signal Sentiment,signal correctio.
VegaXLR - cTrader Multi-Timeframe Pivot Pro
Customizable multi-timeframe pivot point indicator for cTrader with alerts, Fibonacci, CPR, and more!
AlphaTrend Pro by LudwigICT
[Hamster-Coder] Pivot Points
[Hamster-Coder] Pivot Points (Standard)
Indicatore
Grid
RSI
XAUUSD
+14
Trend Entropy pro
Entropy is the scientific measure of disorder or uncertainty in a system
Indicatore
Indices
Prop
Breakout
+3
NY ORB Aegis
NY Session ORB
Indicatore
RSI
Breakout
XAUUSD
+4
SmartTrend Support & Resistance Lines
🚀 Auto-detects support/resistance & trend channels! Saves time ⏳, spots key levels 🔍
NNFX TP AND SL V1.1
A lightweight cTrader indicator that overlays ATR-based SL and TP levels in pips directly on your chart
Indicatore
NAS100
NZDUSD
XAUUSD
+13
MACD Histogram PRO
Enhance MACD Histogram! Visualize bull and bear price changes with vibrant colors for clearer, more insightful trading.