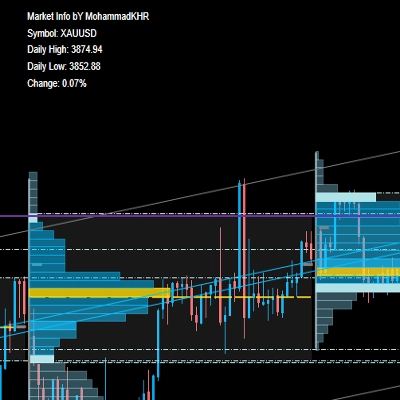
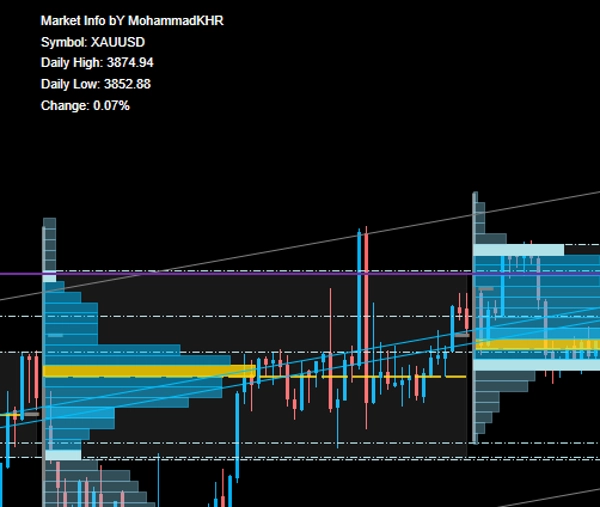
Market Info bY MohammadKHR
อินดิเคเตอร์
217 ดาวน์โหลด
เวอร์ชัน 1.0, Sep 2025
Windows, Mac
คำอธิบาย
- ราคาสูงสุด & ต่ำสุดรายวัน: ดูราคาสูงสุดและต่ำสุดของวันสำหรับเครื่องมือใดก็ได้ทันที
- การเปลี่ยนแปลงเปอร์เซ็นต์แบบสด: ติดตามการเปลี่ยนแปลงราคาตามเปอร์เซ็นต์แบบเรียลไทม์ ช่วยให้คุณประเมินแรงขับเคลื่อนของตลาดได้อย่างรวดเร็ว
- การแสดงผลที่ใช้งานง่าย: อินเทอร์เฟซที่สะอาดและเรียบง่าย เหมาะสำหรับทั้งผู้เริ่มต้นและเทรดเดอร์ที่มีประสบการณ์
- ใช้งานฟรี
สรุป
สรุปโดย AI
Market Info by MohammadKHR is a trading indicator that provides real-time daily high and low prices for any financial instrument. It features a live percentage change display, allowing users to monitor price movements and market momentum instantly. The indicator supports various markets and symbols including Forex (e.g., EURUSD, GBPUSD, USDJPY, NZDUSD), cryptocurrencies (e.g., BTCUSD), commodities (e.g., XAUUSD), indices (e.g., NAS100), and stocks. Its user interface is designed to be clean and minimalistic, suitable for both beginners and experienced traders. This tool helps traders quickly assess daily price extremes and percentage changes to inform trading decisions.
โปรไฟล์อินดิเคเตอร์
รีวิวจากลูกค้า
0.0
รีวิว: 0
รีวิวจากลูกค้า
ยังไม่มีรีวิวสำหรับผลิตภัณฑ์นี้ หากเคยลองแล้ว ขอเชิญมาเป็นคนแรกที่บอกคนอื่น!
การสนทนา
คำถามที่พบบ่อย
BTCUSD
Forex
Signal
Indices
EURUSD
Commodities
GBPUSD
NZDUSD
Prop
Crypto
Stocks
XAUUSD
NAS100
USDJPY
ผลิตภัณฑ์ที่มีให้บริการผ่าน cTrader Store รวมถึงบอทการเทรด อินดิเคเตอร์ และปลั๊กอิน มีให้บริการโดยนักพัฒนาบุคคลที่สามและมีไว้เพื่อวัตถุประสงค์ในการเข้าถึงข้อมูลและทางเทคนิคเท่านั้น cTrader Store ไม่ใช่โบรกเกอร์และไม่ได้ให้คำแนะนำการลงทุน คำแนะนำส่วนบุคคล หรือการรับประกันผลการดำเนินงานในอนาคต


ราคา
2
การขาย
217
ติดตั้งฟรี