
PivotLevels
Indikator
1 käufe
Version 1.0, Sep 2025
Windows, Mac
4.5
Bewertungen: 2
Beschreibung
Pivot-Punkte-Indikator
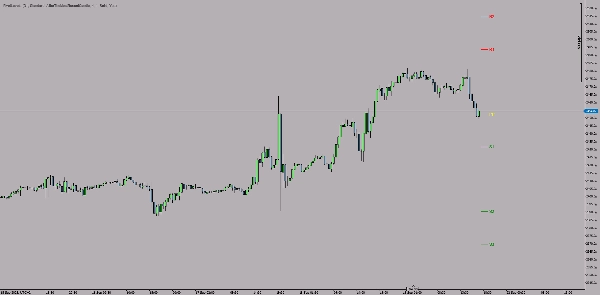
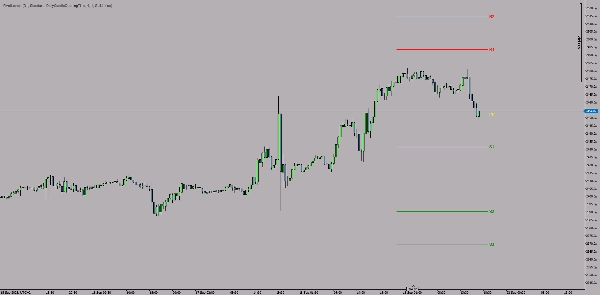
Der Pivot-Punkte-Indikator ist ein technischer Indikator für die cTrader-Plattform, der automatisch Pivot-Punkte berechnet und als Trendlinien im Chart anzeigt.
Hauptmerkmale:
🎯 Pivot-Typen:
- Standard Pivot-Punkte
- Fibonacci Pivot-Punkte
- Woodie Pivot-Punkte
- Camarilla Pivot-Punkte
📊 Levels:
- Zentraler Pivot-Punkt (PP) - gelb
- Widerstandsniveaus (R1, R2, R3) - rot
- Unterstützungsniveaus (S1, S2, S3) - grün
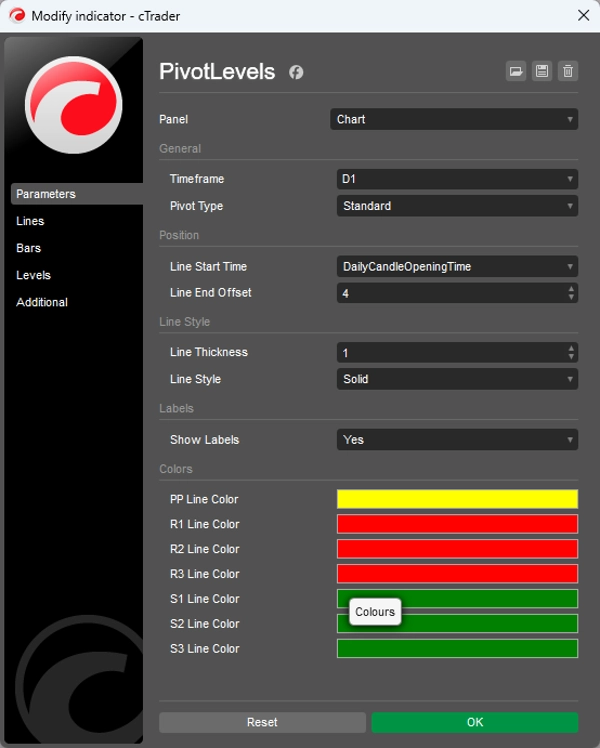
⚙️ Anpassbare Einstellungen:
- Zeitrahmen: Auswahl von täglich, wöchentlich oder anderen Zeitrahmen
- Linienstil: Dicke (1-5) und Typ (durchgezogen, gestrichelt, etc.)
- Positionierung: Startzeit und Länge der Linie
- Farben: Farbe jedes Levels individuell anpassbar
- Beschriftungen: Textbeschriftungen ein-/ausschalten
💡 Verwendung:
Der Indikator berechnet Pivot-Level basierend auf den Hoch-, Tief-, Schluss- (und Eröffnungs-) Werten der vorherigen Periode (Tag/Woche), welche wichtige Unterstützungs- und Widerstandsbereiche für die nächste Handelsperiode identifizieren.
Ideal für Swing- und Daytrader, die Strategien basierend auf technischen Levels anwenden.
Zusammenfassung
KI-Zusammenfassung
PivotLevels is a technical indicator for the cTrader platform that automatically calculates and displays pivot points as trendlines on trading charts. It supports multiple pivot point calculation methods, including Standard, Fibonacci, Woodie, and Camarilla pivots. The indicator plots key levels such as the Central Pivot Point (PP) in yellow, resistance levels (R1, R2, R3) in red, and support levels (S1, S2, S3) in green.
Users can customize various settings, including the timeframe for pivot calculation (daily, weekly, or others), line style (thickness and type), line positioning (start time and length), colors for each level, and the option to toggle text labels on or off. The pivot levels are derived from the previous period’s high, low, close, and open prices, helping identify potential support and resistance zones for the upcoming trading period.
This indicator is suitable for traders who use technical levels in their strategies, particularly swing and day traders. It supports multiple markets such as forex, indices, commodities, cryptocurrencies, and stocks.
Indikatorprofil
Kundenbewertungen
4.5
Bewertungen: 2
5 | 50 % | |
4 | 50 % | |
3 | 0 % | |
2 | 0 % | |
1 | 0 % |
Kundenbewertungen
September 30, 2025
The review gets easier when the decision feels less rushed, and The setup needs patience.
Diskussion
Häufig gestellte Fragen (FAQ)
Prop
Forex
Indices
Commodities
Crypto
Stocks
Über den cTrader Store verfügbare Produkte, einschließlich Handelsbots, Indikatoren und Plugins, werden von externen Entwicklern bereitgestellt und nur zu Informations- und technischen Zugriffszwecken verfügbar gemacht. cTrader Store ist kein Broker und erbringt keine Anlageberatung, persönlichen Empfehlungen oder eine Garantie für zukünftige Performance.


Preis
Seit 05/01/2025
14
Verkäufe