
Beschreibung
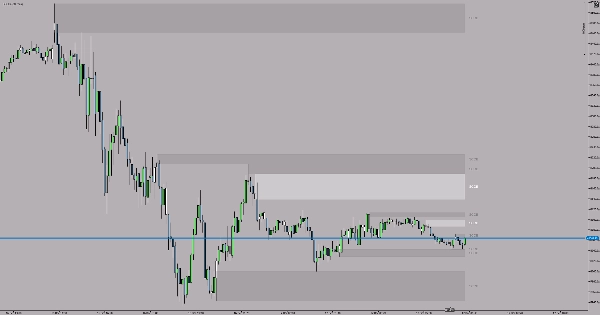
Der SCOB (Single Candle Order Block) Indikator erkennt und hebt automatisch kraftvolle Orderblock-Muster in Ihrem Chart hervor. Dieses einfache, aber effektive Werkzeug hilft Tradern, wichtige Umkehrmuster zu erkennen, die oft auf starke institutionelle Aktivitäten hinweisen.
Was ist ein SCOB?
Ein SCOB ist ein Drei-Kerzen-Muster, das potenzielle Umkehrzonen aufzeigt:
Bullischer SCOB:
- Die 2. Kerze bildet ein tieferes Tief als die 3. Kerze
- Das Tief der 1. Kerze bleibt über dem Tief der 2. Kerze
- Die 1. Kerze schließt über dem Hoch der 2. Kerze
- Die 2. Kerze wird hervorgehoben als potenzielle Unterstützungszone
Bärischer SCOB:
- Die 2. Kerze bildet ein höheres Hoch als die 3. Kerze
- Das Hoch der 1. Kerze bleibt unter dem Hoch der 2. Kerze
- Die 1. Kerze schließt unter dem Tief der 2. Kerze
- Die 2. Kerze wird hervorgehoben als potenzielle Widerstandszone
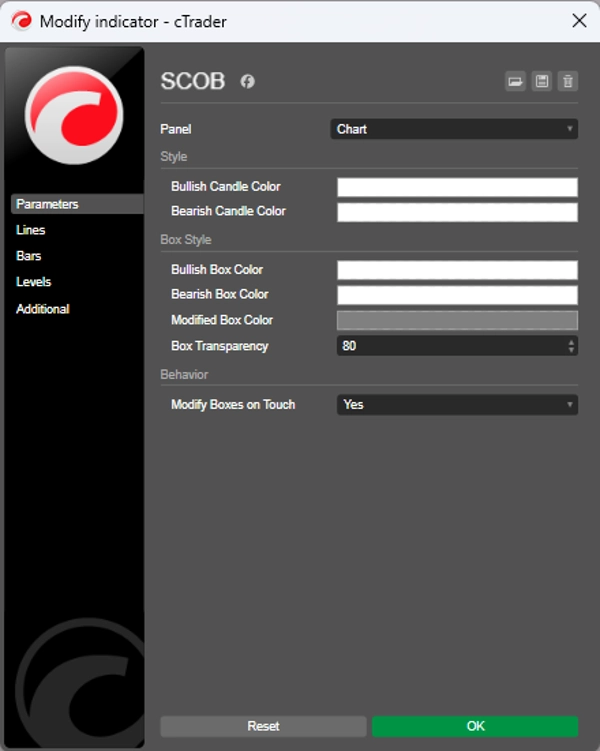
Einstellungen
Farbe der bullischen Kerze - Wählen Sie die Hervorhebungsfarbe für bullische SCOB-Muster (Standard: Weiß)
Farbe der bärischen Kerze - Wählen Sie die Hervorhebungsfarbe für bärische SCOB-Muster (Standard: Gelb)
Nutzungstipps
- Verwenden Sie SCOB-Muster, um potenzielle Einstiegszonen zu identifizieren
- Kombinieren Sie sie mit anderen technischen Analysewerkzeugen zur Bestätigung
- Die hervorgehobene Kerze stellt ein wichtiges institutionelles Niveau dar
- Handeln Sie immer mit dem Trend für höherwahrscheinliche Setups
- Kann auf jedem Zeitrahmen basierend auf Ihrer Handelsstrategie verwendet werden
- Beste Praxis: Markieren Sie SCOB-Muster auf höheren Zeitrahmen (H1, H4, Daily) und handeln Sie in Trendrichtung.
Zusammenfassung
Indikatorprofil
Kundenbewertungen
4.5
Bewertungen: 2
5 | 50 % | |
4 | 50 % | |
3 | 0 % | |
2 | 0 % | |
1 | 0 % |
Kundenbewertungen
October 3, 2025
Helps more when the trader avoids forced trades. It should not replace the chart.
Diskussion
Häufig gestellte Fragen (FAQ)
BTCUSD
Forex
Indices
EURUSD
Commodities
GBPUSD
Prop
Scalping
SMC
Crypto
Stocks
XAUUSD
NAS100
USDJPY
Über den cTrader Store verfügbare Produkte, einschließlich Handelsbots, Indikatoren und Plugins, werden von externen Entwicklern bereitgestellt und nur zu Informations- und technischen Zugriffszwecken verfügbar gemacht. cTrader Store ist kein Broker und erbringt keine Anlageberatung, persönlichen Empfehlungen oder eine Garantie für zukünftige Performance.


Preis
Seit 05/01/2025
14
Verkäufe