
Beschreibung
CandleColourFlow ist ein innovativer Indikator, der entwickelt wurde, um Trends und Wendepunkte auf dem Forex-Markt klar und schnell zu erkennen. Mit seinem einfachen und intuitiven Farbsystem können auch Anfänger fundiertere Handelsentscheidungen treffen.
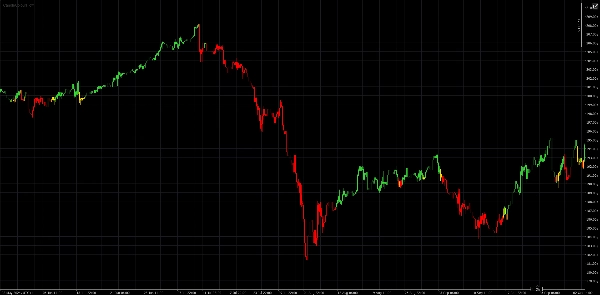
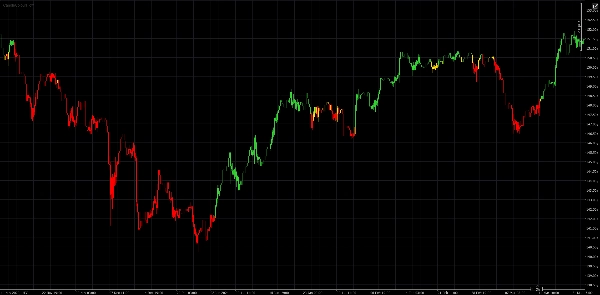
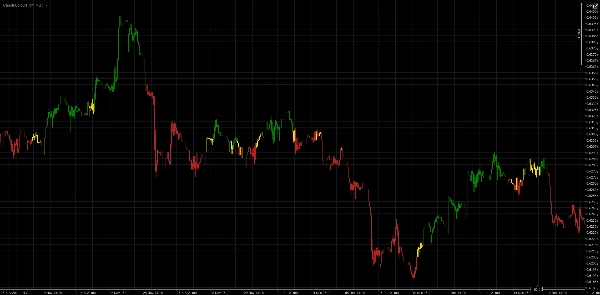
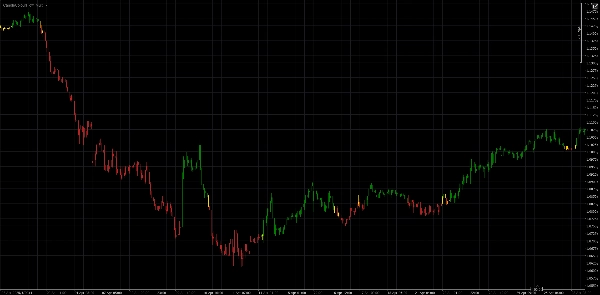
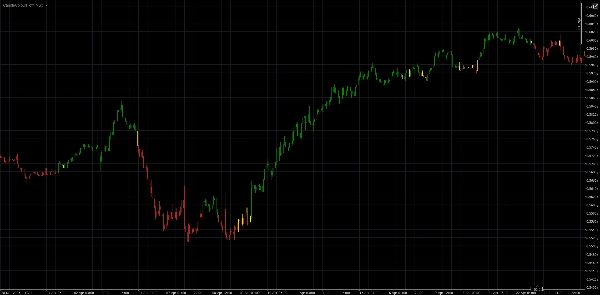
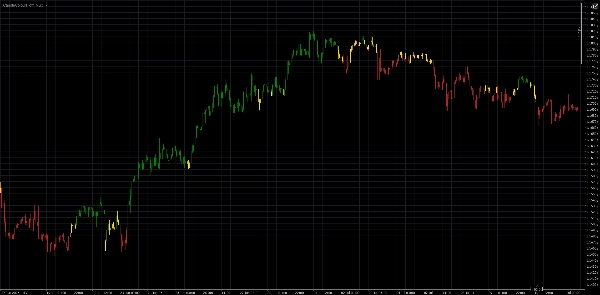
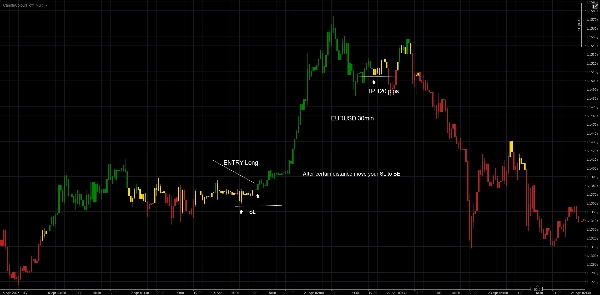
🔹 Grüne Kerzen – deuten auf günstige Bedingungen zum Eröffnen von Long-Positionen hin
🔹 Rote Kerzen – deuten auf eine potenzielle Gelegenheit für einen Short-Trade hin
🔹 Goldene Kerzen – signalisieren Marktunsicherheit: mögliche Konsolidierung oder Fortsetzung des Trends
💡 Was macht CandleColourFlow einzigartig?
- Klare visuelle Einsicht in die Marktbedingungen ohne die Notwendigkeit mehrerer Indikatoren
- Automatische Erkennung von Momentumwechseln und Änderungen der Preisstruktur
- Perfekt, um den Gesamtmarkt schnell zu beurteilen
- Funktioniert auf allen Zeitrahmen, meiner Meinung nach sind 1h+ am besten, aber alles hängt von den Vorlieben ab
⚠️ Rechtlicher Hinweis:
Dieser Indikator dient ausschließlich zu Bildungszwecken. Er stellt keine Anlageberatung oder Empfehlung zur Durchführung finanzieller Transaktionen dar.
Auf der Suche nach mehr?
Weitere Versionen von CandleColourFlow kommen bald – jede mit einzigartigen Funktionen und breiterer Marktabdeckung.
Zusammenfassung
Kundenbewertungen
5 | 0 % | |
4 | 100 % | |
3 | 0 % | |
2 | 0 % | |
1 | 0 % |


