
Beschreibung
📌 CandleColourFlow_Limited_EURUSD – Demo-Version
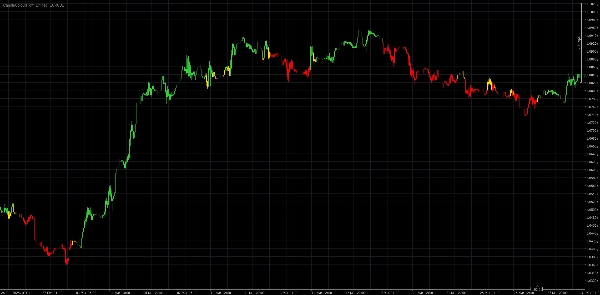
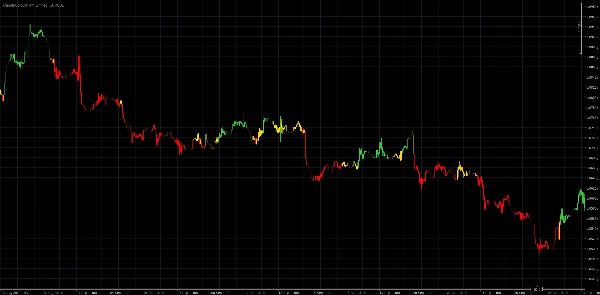
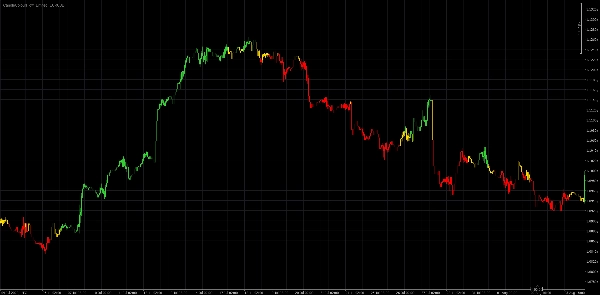
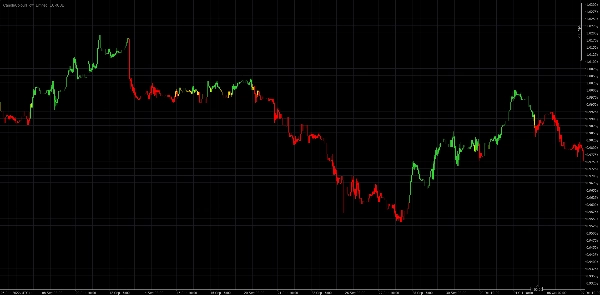
CandleColourFlow ist ein innovativer Indikator, der entwickelt wurde, um Trends und Wendepunkte auf dem Forex-Markt klar und schnell zu erkennen. Mit seinem einfachen und intuitiven Farbsystem können auch Anfänger im Handel fundiertere Entscheidungen treffen.
🔹 Grüne Kerzen – deuten auf günstige Bedingungen zum Eröffnen von Long-Positionen hin
🔹 Rote Kerzen – deuten auf eine potenzielle Gelegenheit für Short-Trades hin
🔹 Goldene Kerzen – signalisieren Marktunsicherheit: mögliche Konsolidierung oder Fortsetzung des Trends
💡 Was macht CandleColourFlow einzigartig?
- Klare visuelle Einsicht in die Marktbedingungen ohne die Notwendigkeit mehrerer Indikatoren
- Automatische Erkennung von Momentumwechseln und Veränderungen in der Preisstruktur
- Perfekt, um den Gesamtmarkt schnell zu beurteilen
⚠️ Rechtlicher Hinweis:
Dieser Indikator dient ausschließlich zu Bildungszwecken. Er stellt keine Anlageberatung oder Empfehlung zur Durchführung finanzieller Transaktionen dar.
Suchen Sie nach mehr?
Weitere Versionen von CandleColourFlow erscheinen bald – jede mit einzigartigen Funktionen und breiterer Marktabdeckung.


![„High-Low Divergence [Iridio Capital]“-Logo](https://cdn.ctrader.com/image/webp/443c4661-7abb-40f1-842f-4b6ec560649b_40914)


![„[Hamster-Coder] Price“-Logo](https://cdn.ctrader.com/image/webp/893fb641-d5b3-44d8-91fb-6a2dc6f3d309_30647)