
WaveWeisBarForce
Indicatore
169 download
Versione 1.0, Dec 2025
Windows, Mac
5.0
Recensioni: 2
Descrizione
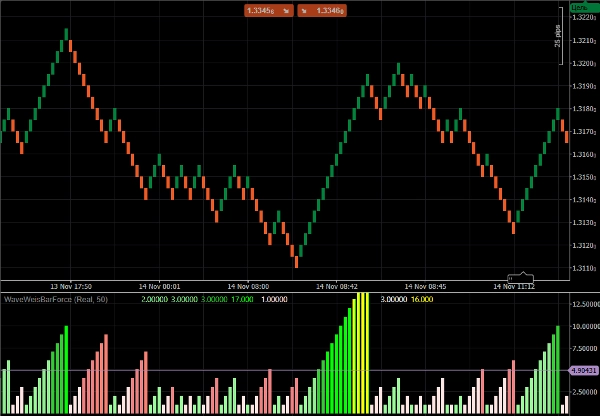
Wave Weis Bar Force - è un indicatore che applica la logica delle onde di volume (Weis) per determinare l'accumulazione e i cambiamenti nella direzione del mercato.
Riassume il volume mentre la tendenza rimane invariata. Quando la direzione cambia, inizia una nuova onda e l'accumulazione viene azzerata.
L'intensità è calcolata per livelli, in base al rapporto tra il volume dell'onda corrente e la più grande accumulazione recente. Serve come filtro aggiuntivo e si mostra efficace nelle strategie di tendenza.
Riepilogo
Riepilogo AI
Wave Weis Bar Force is a technical indicator that applies the concept of Volume Waves (Weis) to identify market accumulation phases and detect changes in market direction. It aggregates volume data while the current trend persists, resetting accumulation when a new wave begins with a trend reversal. The indicator calculates intensity levels based on the ratio of the current wave's volume to the largest recent accumulation, providing a quantitative measure of volume strength. This functionality serves as an additional filter and is particularly useful in trending market strategies. The indicator supports analysis across multiple markets including Forex, Crypto, and Stocks, and is applicable to trading approaches such as breakout and scalping strategies.
Profilo indicatore
Recensioni dei clienti
5.0
Recensioni: 2
5 | 100 % | |
4 | 0 % | |
3 | 0 % | |
2 | 0 % | |
1 | 0 % |
Recensioni dei clienti
December 10, 2025
WaveWeisBarForce blends Weis Wave logic with bar-strength analysis to show real buying/selling force. Clean histogram, stable performance, great for confirming impulses and spotting exhaustion. Useful for Wyckoff, VSA and intraday momentum traders.
Discussioni
Domande frequenti
Forex
Breakout
Scalping
Crypto
Stocks
I prodotti disponibili tramite cTrader Store, inclusi bot di trading, indicatori e plugin, sono forniti da sviluppatori terzi e resi disponibili esclusivamente a scopo informativo e di accesso tecnico. cTrader Store non è un broker e non fornisce consulenze in materia di investimento, raccomandazioni individualizzate o garanzie di risultati futuri.
Altro da questo autore


![Logo di "[Hamster-Coder] Moving Average MTF"](https://cdn.ctrader.com/image/webp/b11b98b1-194d-4b8e-b00e-d611826ad159_31226)


Prezzo
Da 24/10/2025
1.43M
Volume negoziato
4.79K
Profitto in pip
2
Vendite
317
Installazioni gratuite