present
Registrieren Sie sich und erhalten Sie $50 Rabatt auf Ihren ersten Kauf
Trading product for HIO RSI Multi Currency Scanner Pro Indikator RSI Volume, image 1
HIO RSI Multi Currency Scanner Pro
Indikator
Version 1.1, May 2026
Windows, Mac
4.7
Bewertungen: 4
Trading product for HIO RSI Multi Currency Scanner Pro Indikator RSI Volume, image 2
Trading product for HIO RSI Multi Currency Scanner Pro Indikator RSI Volume, image 3
Trading product for HIO RSI Multi Currency Scanner Pro Indikator RSI Volume, image 4
Trading product for HIO RSI Multi Currency Scanner Pro Indikator RSI Volume, image 5
Seit 12/06/2025
1
Verkäufe
424
Kostenlose Installationen

Beschreibung

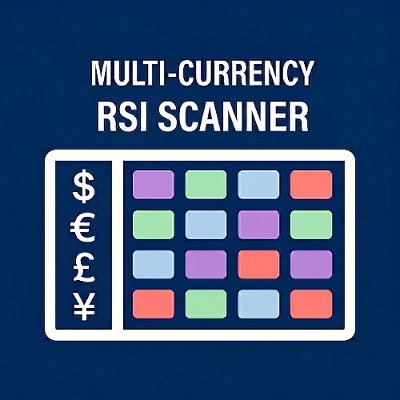
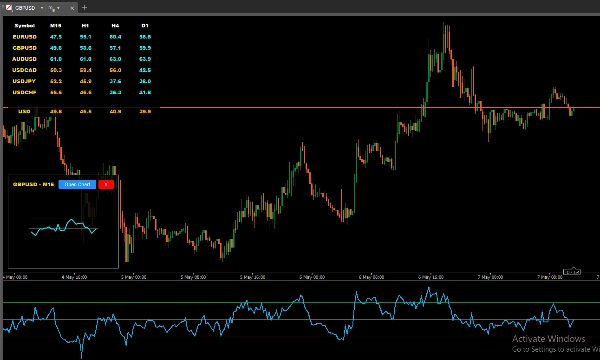
Der HIO RSI Multi Currency Scanner Pro ist ein analytisches Dashboard, das Ihnen hilft, das Marktmomentum zu überwachen. Anstatt zwischen mehreren Charts zu wechseln, bietet dieses Tool eine konsolidierte Ansicht, um RSI-Werte über verschiedene Symbole und Zeitrahmen gleichzeitig zu verfolgen. Es wurde entwickelt, um Händlern dabei zu helfen, Marktbedingungen effizient zu erkennen.

Hauptmerkmale

  • Integration der Währungsstärke: Berechnet die gewichtete Stärke einer Zielwährung basierend auf RSI und Volumen über ausgewählte Paare.
  • Interaktive Mini-Charts: Klicken Sie auf eine beliebige Datenzelle, um ein sofortiges Popup-Mini-Chart der RSI-Historie anzuzeigen, ohne Ihren aktuellen Arbeitsbereich zu verlassen.
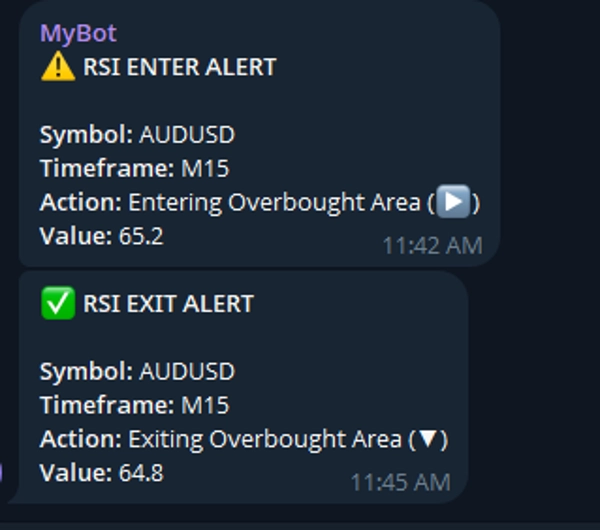
  • Intelligente Benachrichtigungen: Erhalten Sie Benachrichtigungen, wenn der RSI bestimmte Extremzonen betritt oder verlässt, über Messaging-Integration.
  • Duale Berechnungsmodi: Wählen Sie zwischen Live für Echtzeit-Tracking oder BarClose für Updates beim Kerzenschluss.
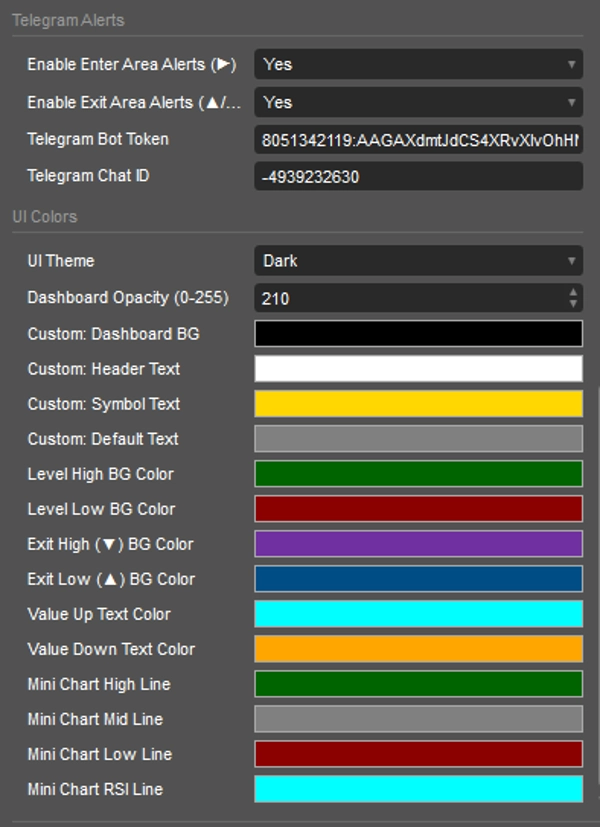
  • Anpassbare Benutzeroberfläche: Unterstützung für Dunkel-, Hell- und benutzerdefinierte Themen mit einstellbarer Transparenz und einer dedizierten Tastenkombination zum Umschalten der Dashboard-Sichtbarkeit.

Visuelle Warnungen & Farb-Logik

Das Dashboard verwendet ein intuitives Farbcodierungssystem, das Ihnen hilft, Marktbedingungen schnell zu erkennen:

  • Hintergrundfarben (Zonen):
    • Dunkelgrün / Dunkelrot: Der RSI befindet sich derzeit in der Überkauft- / Überverkauft-Zone.
    • Lila / Blau: Der RSI hat gerade die Überkauft- / Überverkauft-Zone verlassen.
  • Textfarben (Momentum): Aqua / Orange: Der RSI-Wert steigt / fällt im Vergleich zur vorherigen Kerze.
  • Richtungsanzeiger: Der Text wird dynamisch aktualisiert, um anzuzeigen, ob der RSI die Zonen betritt oder verlässt.

(Hinweis: UI- und Textfarben sind über die Einstellungen vollständig anpassbar)

Einrichtung & Parameter

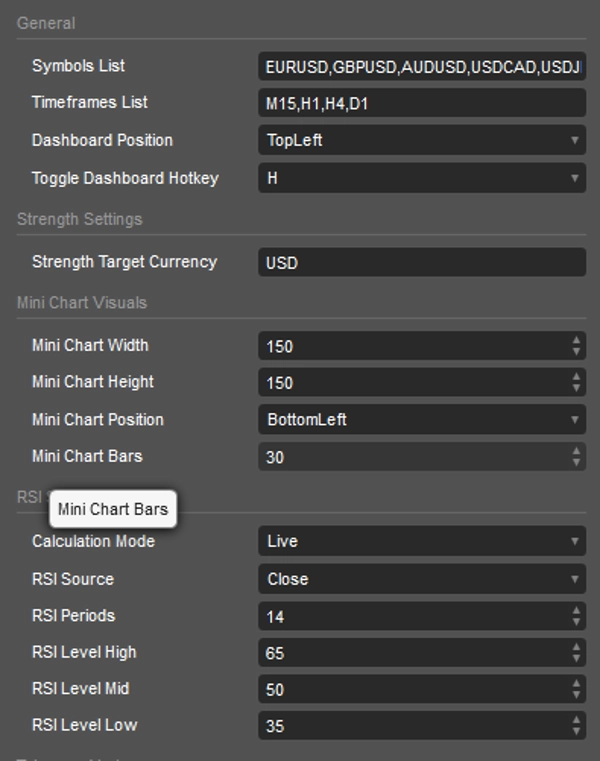
  • Allgemein: Definieren Sie Ihre Symbol- und Zeitrahmenlisten. Legen Sie die Position des Dashboards und Ihre bevorzugte Tastenkombination fest.
  • RSI-Kern: Passen Sie die RSI-Perioden an, wählen Sie die RSI-Quelle und legen Sie spezifische Schwellenwerte für hohe, mittlere und niedrige Werte fest.
  • Stärke-Einstellungen: Geben Sie Ihre Zielwährung ein, um deren Gesamtmomentum zu überwachen.
  • Benachrichtigungen: Geben Sie Ihre Einstellungen ein, um Fernbenachrichtigungen für Eintritts- oder Austrittswarnungen zu aktivieren.

Verbessern Sie Ihre Handelsroutine mit einem Tool, das für Klarheit entwickelt wurde. Der HIO RSI Multi Currency Scanner Pro wurde entwickelt, um Ihren Multi-Asset-Überwachungsprozess zu optimieren.

Zusammenfassung

KI-Zusammenfassung
The HIO RSI Multi Currency Scanner Pro is an analytical dashboard designed for monitoring Relative Strength Index (RSI) levels across multiple symbols and timeframes simultaneously. It consolidates market momentum data into a single interface, reducing the need to switch between charts. Key features include currency strength integration, which calculates weighted strength of a target currency based on RSI and volume across selected pairs. The tool offers interactive mini-charts accessible via clickable data cells, enabling quick RSI history review without leaving the workspace. It supports smart alerts that notify users when RSI enters or exits specified extreme zones through messaging integration. Users can select between live real-time tracking or updates upon candle close with dual calculation modes. The customizable user interface supports dark, light, and custom themes, adjustable opacity, and a hotkey to toggle dashboard visibility. Visual alerts use color-coded backgrounds and text to indicate RSI zones and momentum changes, with full customization available. Setup options allow defining symbols and timeframes, adjusting RSI parameters, setting target currencies for strength monitoring, and configuring remote notifications. This tool is intended to streamline multi-asset RSI monitoring for traders seeking a comprehensive momentum overview.
Indikatorprofil
Indikatorkategorie
Momentum
Ausgabetyp
Visualisierung
Signale
Filter
Datenanforderungen
Nur Balken
Tick-Daten
Volumen
Unterstützte Signale
Durchbrechen
Wendepunkt

Kundenbewertungen

4.7
Bewertungen: 4
5
75 %
4
25 %
3
0 %
2
0 %
1
0 %
Kundenbewertungen
May 20, 2026
A 12 trade note set is enough for first impressions. It keeps the review from getting sloppy.
May 18, 2026
H1 makes the signal less noisy. The setup gets an extra sanity check.
May 18, 2026
ngl, timing feels less random and that is enough to keep testing it. M15 is enough for the first pass.
May 15, 2026
No reason to yolo this live without a few normal sessions. It needs a few bad trades in the sample too.

Diskussion

Häufig gestellte Fragen (FAQ)

RSI
Volume
Über den cTrader Store verfügbare Produkte, einschließlich Handelsbots, Indikatoren und Plugins, werden von externen Entwicklern bereitgestellt und nur zu Informations- und technischen Zugriffszwecken verfügbar gemacht. cTrader Store ist kein Broker und erbringt keine Anlageberatung, persönlichen Empfehlungen oder eine Garantie für zukünftige Performance.

Mehr von diesem Autor

Indikator
Forex
BTCUSD
+9
On-chart economic calendar with custom filters and automated Telegram alerts. Never miss high-impact news!
Indikator
Forex
BTCUSD
+13
Multi-symbol Inside Bar Scanner with dashboard & breakout alerts
Indikator
Forex
BTCUSD
+10
(ViPi) MTF Candle displays multiple higher timeframe candles right on your current chart for ultimate trend analysis.
Indikator
Prop
Forex
+14
Pro Inside Bar Scanner with smart Telegram alerts & multi-timeframe dashboard
Indikator
Volume
Stochastic
Multi-symbol & multi-timeframe Stochastic scanner with interactive mini-charts and Telegram alerts
Indikator
CCI
Volume
Monitor multiple pairs and timeframes with this interactive CCI dashboard. Includes mini-charts & Alerts.
Indikator
Key Levels
Display live economic events directly on your chart with impact filters and automated advance notifications.

Das könnte Sie auch noch interessieren

Indikator
Prop
Forex
+13
Supertrend - Multi-Timeframe Indicator
Indikator
SMC
Prop
+14
FVG Multi Time Frame Indicator
Indikator
Signal
Breakout
+1
Bolliger Bands + Hamster-Coder™ Timeframe Decoupling
„MARainbow“-Logo
Beste Ratings
4.2
(4)
$19
/
$38
Indikator
Forex
Crypto
+3
MARainbow gives you the edge with four customizable moving averages—each color-coded for instant recognition.
Indikator
Channel
Imbalance
+2
Adaptive volatility channel based on moving average and standard deviation (σ).
Indikator
Moving Average
An Indicator made for scalping. Shows you the Sniper movement on Chart with the colour signals.
Indikator
ATR
RSI
+7
Track the Movement of Market Assets with an Oscillator Scanner in Real-Time!
Indikator
AI
SMC
+5
Complete ICT Killzones: 5 sessions, easy colors, transparency controls & session info. Professional timing for cTrader.
Indikator
RSI
SMC
+17
RSI, MACD, Stochastic, CCI & Momentum divergence scanner with confluence scoring. Never miss a signal again!
Indikator
BOS
MSS
+5
Your entire ICT session map, structure engine, and key levels — No manual work. One indicator. Every session!
Indikator
AI
SMC
+11
Perfect Entry Price designed to help traders identify the most accurate and reliable price levels for market entries
Indikator
Prop
Forex
+10
IBS Indicator – Measures price position within bars for smarter trades. Works on all markets & timeframes.
Indikator
VWAP
Volume
+3
Don't trust static support and resistance levels, this indicator combines Fibonacci and VWAP in one powerful tool.
Indikator
AI
SMC
+4
Weekly Daily Opening Gaps — NWOG & NDOG Indicator Professional-grade opening gap visualization for institutional traders
Indikator
Signal
Trades Opening Range Breakouts Indicator with dynamic stops/targets adapting to market volatility.
Indikator
Signal
This Fair Value Gap (FVG) indicator is a technical analysis on multi-timeframe.
Indikator
RSI
RSI on the main chart with 45/55 momentum levels, overbought/oversold levels, averaged RSI, and multi-timeframe support.
Indikator
RSI
Stochastic
+2
Composite mean-reversion oscillator merging Z-Score, RSI & Bollinger %B into one clear overbought/oversold signal.

Preis

Seit 12/06/2025
1
Verkäufe
424
Kostenlose Installationen