
Indikatorbeschreibung:
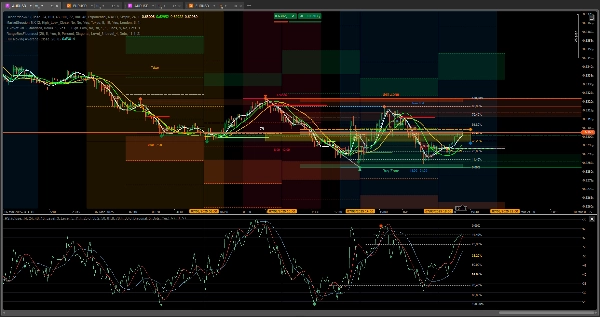
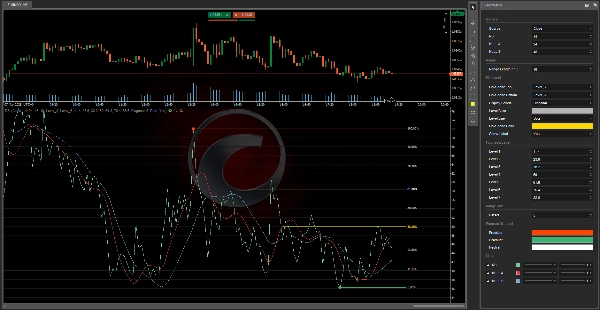
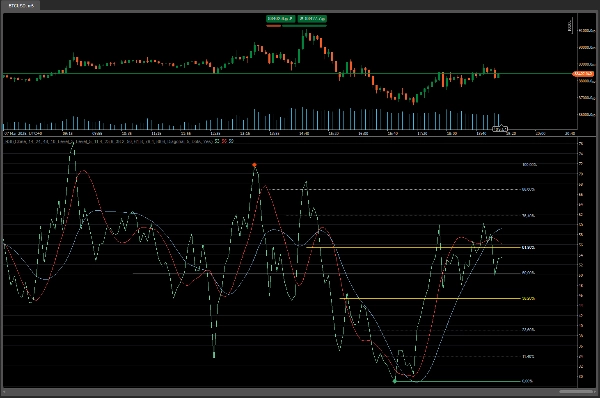
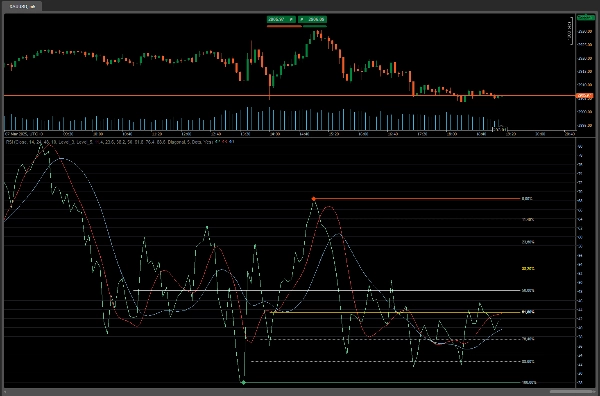
🎯 RSI-Indikator mit Fibonacci-Niveaus und Hull Moving Averages 🚀
Möchten Sie Ihre technische Analyse auf die nächste Stufe heben? Dieser Indikator ist für Sie! Er kombiniert das Beste aus drei leistungsstarken Werkzeugen: den RSI (Relative Strength Index), Fibonacci-Niveaus und Hull Moving Averages um Ihnen eine umfassende und genaue Marktübersicht zu bieten.
Hauptmerkmale:
- RSI mit Fibonacci-Niveaus:
-
- Identifiziert wichtige Unterstützungs- und Widerstandszonen basierend auf Fibonacci-Niveaus.
- Hilft, potenzielle Umkehrungen und Fortsetzungen mit größerer Präzision zu erkennen.
- Hull Moving Averages:
-
- Beinhaltet zwei Hull Moving Averages (Hull A und Hull B), um Marktrauschen herauszufiltern und Trends effizienter zu erfassen.
- Bietet klare Einstiegs- und Ausstiegssignale basierend auf Kreuzungen und Richtungsänderungen.
- Trendwechselzonen:
-
- Hebt kritische Bereiche hervor, in denen wahrscheinlich Trendwechsel auftreten, und hilft Ihnen, bedeutende Bewegungen vorherzusehen.
- Volle Anpassbarkeit:
-
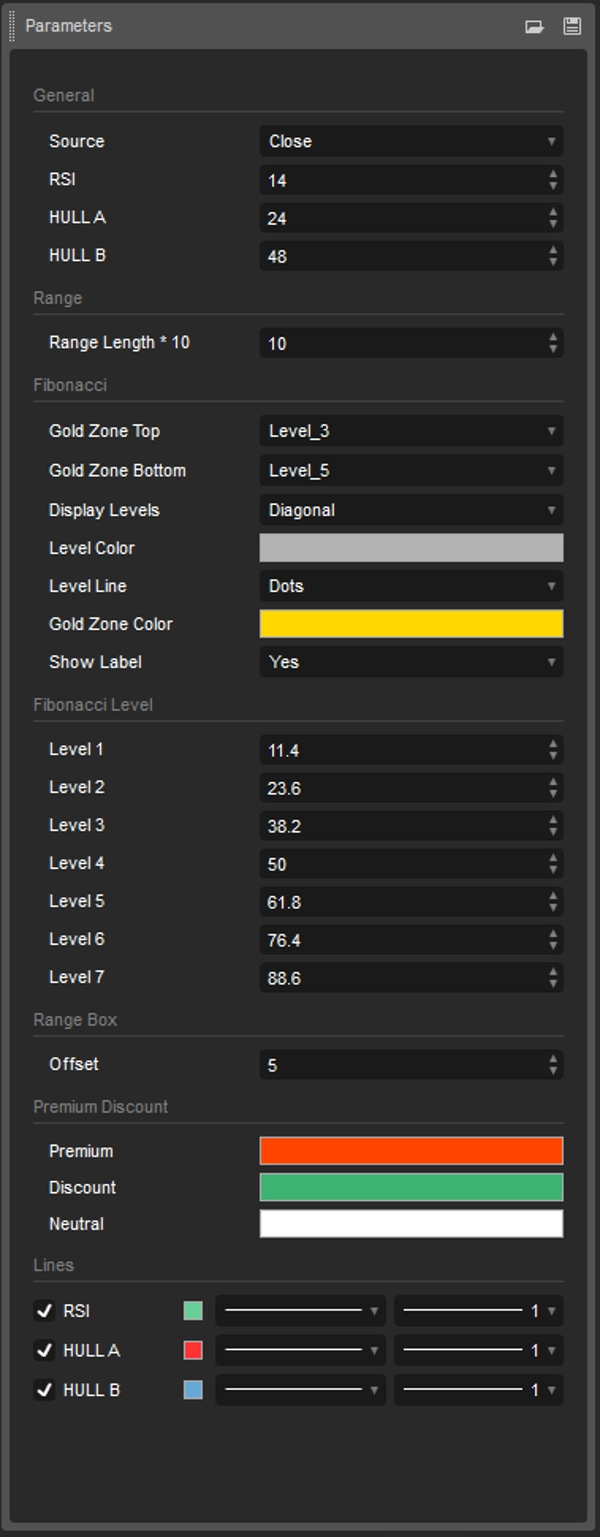
- Passen Sie Fibonacci-Niveaus, Farben und Linienstile nach Ihren Vorlieben an.
- Konfigurieren Sie die Hull Moving Averages entsprechend Ihrer Handelsstrategie.
- Klare Visualisierung:
-
- Gut definierte Symbole und Trendlinien für eine schnelle und einfache Interpretation.
- Optionale Beschriftungen zur Anzeige der Fibonacci-Niveaus in Prozent.
Vorteile für Trader:
- Höhere Genauigkeit: Kombiniert RSI mit Fibonacci-Niveaus und Hull Moving Averages für zuverlässigere Signale.
- Zeitersparnis: Kein Überlagern mehrerer Indikatoren; alles ist in einem Tool integriert.
- Vielseitigkeit: Funktioniert auf jedem Zeitrahmen und Markt (Forex, Aktien, Kryptowährungen usw.).
- Benutzerfreundlichkeit: Entwickelt für Trader aller Erfahrungsstufen, von Anfängern bis zu Experten.
Warum diesen Indikator herunterladen?
- Innovativ: Eine einzigartige Kombination aus klassischen und modernen Werkzeugen, die Sie in anderen Indikatoren nicht finden.
- Effektiv: Hilft Ihnen, Handelsmöglichkeiten mit größerer Klarheit und Sicherheit zu erkennen.
So verwenden Sie ihn:
- Trend erkennen: Verwenden Sie die Hull Moving Averages, um die Marktrichtung zu bestimmen.
- RSI-Signale suchen: Prüfen Sie, ob der RSI sich in überkauften oder überverkauften Bereichen nahe Fibonacci-Niveaus befindet.
- Mit Fibonacci bestätigen: Verwenden Sie Fibonacci-Niveaus, um wichtige Unterstützungs- und Widerstandszonen zu identifizieren.
- Informierte Entscheidungen treffen: Betreten oder verlassen Sie Trades mit größerem Vertrauen basierend auf klaren und präzisen Signalen.
Jetzt herunterladen und Ihr Trading verbessern!
Verschwenden Sie keine Zeit mehr mit manueller Chartanalyse. Mit diesem Indikator haben Sie alles, was Sie brauchen, an einem Ort. Machen Sie Ihr Trading effizienter und profitabler!
Und mit zwei Werkzeugen müssen Sie sich keine Sorgen mehr machen, was der Markt tun wird. Mit einem einfachen Blick wissen Sie – kaufen oder verkaufen und zur nächsten Aufgabe übergehen.
RangeBoxFibonacci: https://ctrader.com/products/526?u=VIZAINT
OrderPrice-V3: https://ctrader.com/products/397?u=VIZAINT
Und zur Auswahl
NTMPICLL https://ctrader.com/products/327?u=VIZAINT
MacdVolume https://ctrader.com/products/267?u=VIZAINT
MarketSession-MX: https://ctrader.com/products/525?u=VIZAINT
5 | 100 % | |
4 | 0 % | |
3 | 0 % | |
2 | 0 % | |
1 | 0 % |


