
Descripción
Este indicador de análisis técnico proporciona información sobre el sentimiento del mercado, la tendencia y los niveles de precio. Utiliza datos como Volumen, Open_Close, Volatilidad de Chaikin y Flujo de Dinero de Chaikin para calcular el sentimiento del mercado. También permite ajustar los spreads, detectar tendencias y visualizar niveles de precio y pips. Es una herramienta útil para identificar la fuerza predominante en el mercado, anticipar movimientos de precio y mejorar la toma de decisiones comerciales.
En la descripción, indico los parámetros importantes; el resto son configuraciones de estilo como color, tipo de línea y tamaño de fuente.
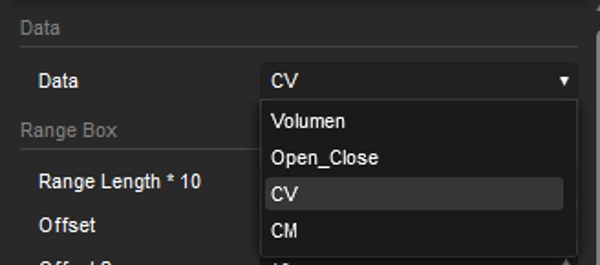
Datos
Los cálculos de sentimiento se basan en la selección entre Volumen, Open_Close, Volatilidad de Chaikin y Flujo de Dinero de Chaikin.
Longitud del Rango * 10
El valor indica el número de velas (periodos) en los que se basa el cálculo – el valor se multiplica por 10.
Agregar Zoom
Para mantener el gráfico centrado, esto también ayuda a considerar situaciones como consolidación y cambios de tendencia.
Margen
Permite ajustar los márgenes superior e inferior para mejorar la visualización.
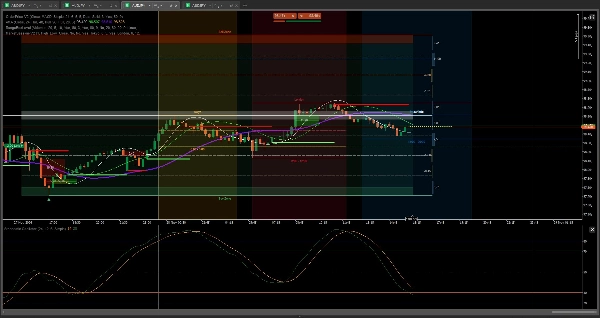
Mostrar Sentimiento
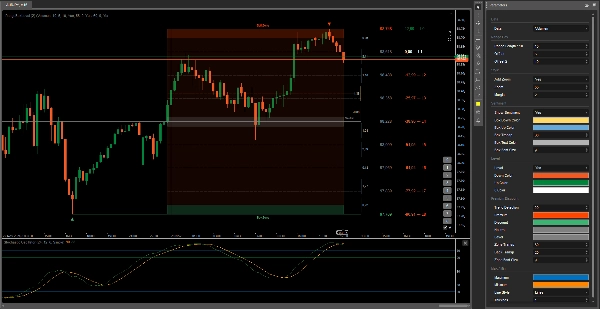
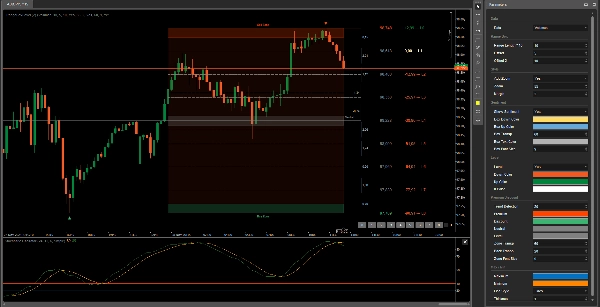
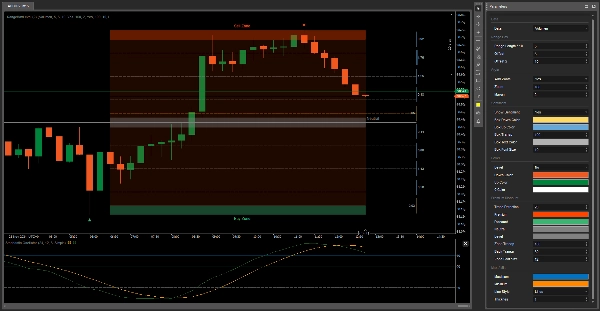
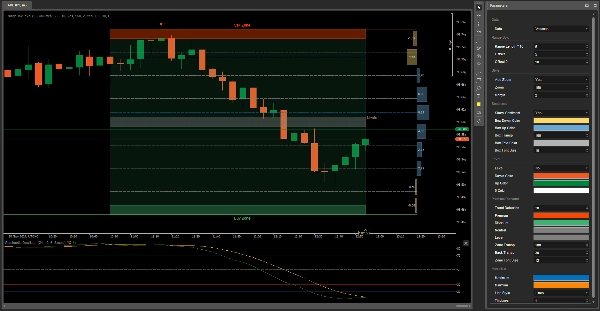
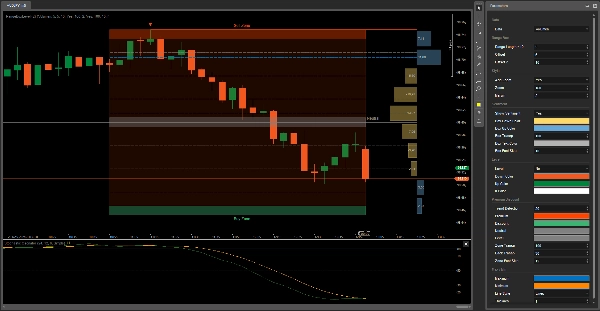
El sentimiento indica qué fuerza es más fuerte en el mercado en ese momento. Si las barras amarillas aumentan de tamaño, significa que hay más vendedores, y viceversa. Si no desea ver la visualización del sentimiento, puede ocultarla en el lado derecho.
Nivel
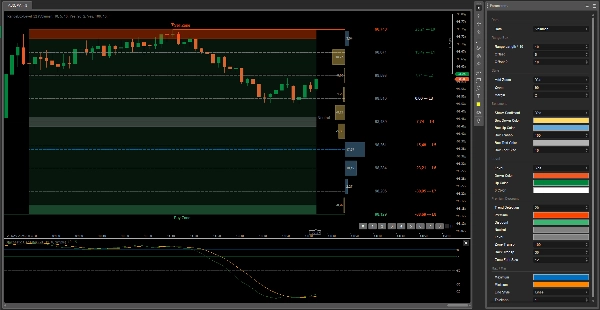
Esta es una función extra que puede usarse como referencia para precios y pips en cada nivel. Cuando selecciona un nivel donde desea colocar la orden de compra, indica los pips en cada nivel que el precio puede alcanzar.
Detección de Tendencia
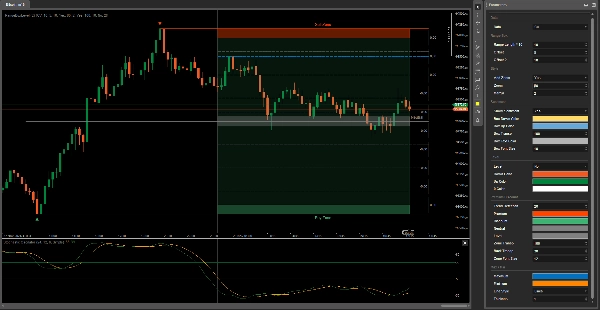
Dependiendo de la tendencia del activo, el fondo del Cuadro de Rango cambia: verde si es alcista y rojo si es bajista.
Máx / Mín
Estas son las líneas azul y amarilla que cambian su posición según la predicción de hacia dónde podría ir el precio. El Cuadro de Rango se divide en 9 secciones para ayudar a determinar los puntos de inflexión del precio, sirviendo como un Retroceso de Fibonacci.
Serás invencible
Buena suerte 😀
Resumen
Key features include sentiment visualization with bars indicating the dominance of buyers or sellers, trend detection through background color changes (green for bullish, red for bearish), and level indicators that display potential price and pip targets for placing orders. The Range Box is divided into nine sections to identify price inflection points, functioning similarly to Fibonacci retracement levels, with dynamic max/min lines predicting possible price movements.
This tool supports analysis across various markets including stocks, cryptocurrencies, indices like NAS100, and commodities such as XAUUSD (gold). It is suitable for trading strategies like scalping and grid trading and can assist traders in anticipating price movements and making informed decisions. The indicator integrates with additional tools for enhanced order price management and market session analysis.
Valoraciones de clientes
5 | 100 % | |
4 | 0 % | |
3 | 0 % | |
2 | 0 % | |
1 | 0 % |


![Logotipo de "Wyckoff Toolkit [Iridio Capital]"](https://cdn.ctrader.com/image/webp/8acfe6a1-6a8e-4578-9367-9df3af2b1801_27763)


