Descripción
El HAI Quantum V10 es un indicador avanzado diseñado para el análisis técnico de activos financieros, particularmente efectivo en mercados volátiles. Su arquitectura combina inteligencia algorítmica con patrones de comportamiento del precio, permitiendo a los traders identificar zonas de alta probabilidad para entradas y salidas.
🔥 ¡Oferta especial de regreso al mercado – Tiempo limitado!
Las vacaciones han terminado, y es hora de volver al negocio. Al despertar los mercados, también debe hacerlo tu estrategia.
Para celebrar el regreso a la acción, estoy ofreciendo mi herramienta de trading más poderosa — HAI Quantum V10 — por solo $49.
Esta es una oferta por tiempo limitado diseñada para traders serios que quieren comenzar la temporada con fuerza. Ya sea que estés perfeccionando tu ventaja o buscando un sistema confiable, esta es tu oportunidad de obtener un indicador probado a un precio especial.
✅ Construido para Oro (XAUUSD) ✅ Probado en múltiples marcos temporales ✅ Diseñado por un trader, para traders
No esperes — esta oferta no durará. Vuelve al juego con confianza y precisión.
Nuestro producto integra un conjunto de indicadores clave para brindarte una perspectiva completa del mercado:
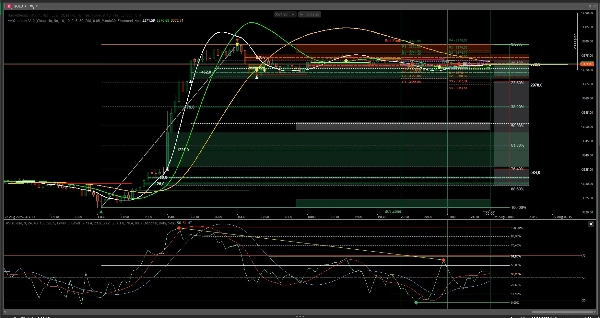
- Range Box Fibonacci (nuestra propia creación): Una herramienta única que te ayuda a identificar zonas potenciales de soporte y resistencia basadas en niveles de Fibonacci.
- Precios de Referencia Clave: Determinamos puntos de precio cruciales a partir de la confluencia de tres indicadores personalizables (CCI, Estocástico, RSI). Estos puntos te guiarán para identificar oportunidades de entrada y salida.
- Tres Medias Móviles Configurables: Elige las medias móviles que mejor se adapten a tu estrategia para confirmar tendencias y detectar cambios en la dirección del precio.
- RSI: Para predicciones más precisas del movimiento del precio. Con valores altos y bajos para períodos seleccionados. No incluido en la visualización.
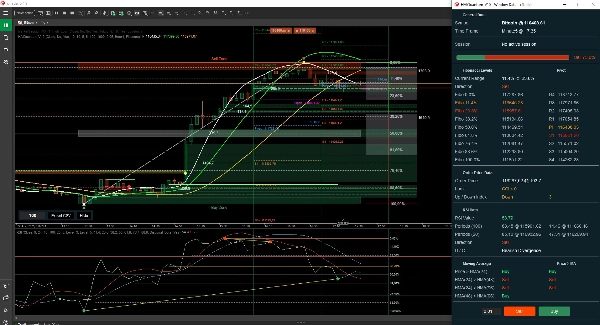
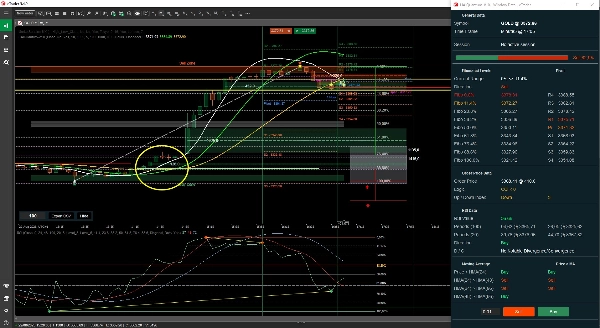
HAI Quantum recopila y procesa datos de estos indicadores, ofreciéndote dos métodos de visualización:
- Modo Manual: Una ventana clara y concisa que resume si el precio, según cada configuración de indicador, se dirige hacia arriba o hacia abajo.
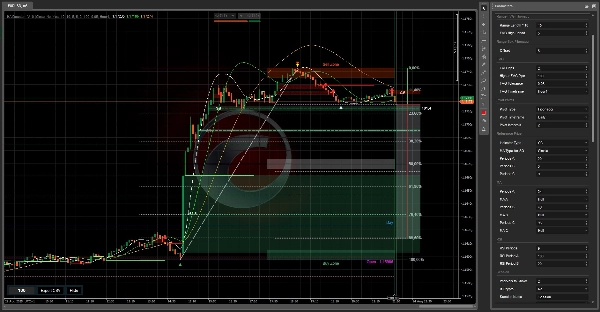
- Nueva ventana de datos con niveles destacados de Fibonacci y Pivote: En esta nueva versión, hemos integrado FVG (Fair Value Gap), que puede filtrarse por tamaño y su proximidad a un nivel de Fibonacci o Pivote, junto con sus puntos de mitigación, como se muestra en la imagen.
Resumen
Valoraciones de clientes
5 | 100 % | |
4 | 0 % | |
3 | 0 % | |
2 | 0 % | |
1 | 0 % |