
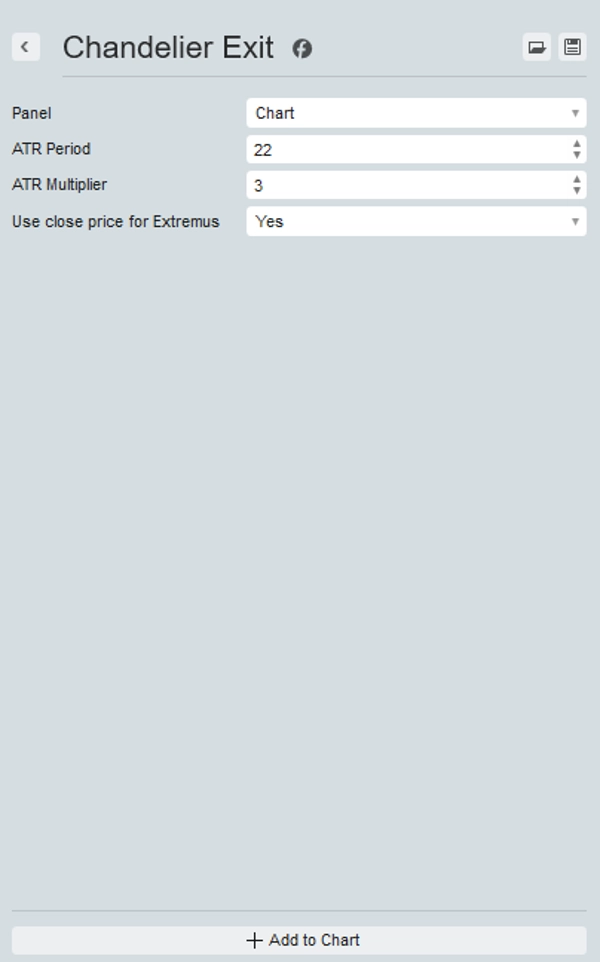
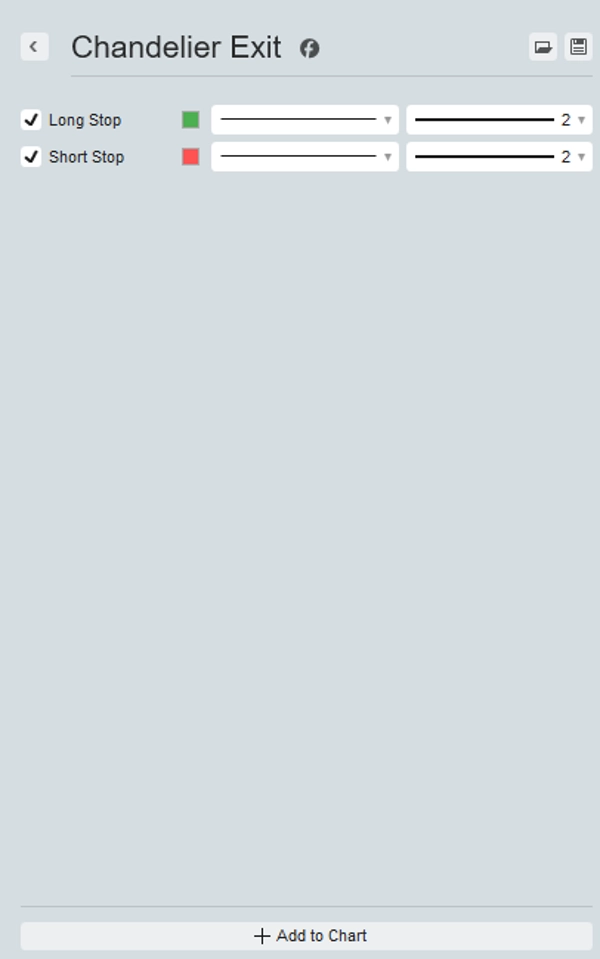
Chandelier Exit
Wskaźnik
5 zakupy
Wersja 1.0, Oct 2025
Windows, Mac
4.3
Opinie: 3
Opis
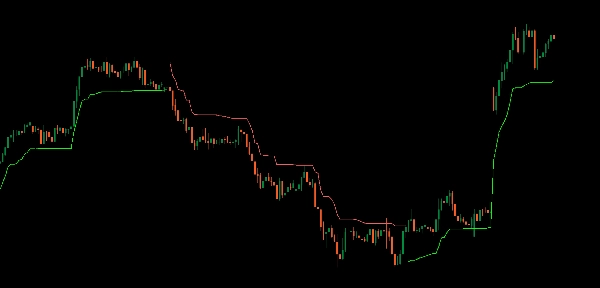
Przedstawiamy wskaźnik Chandelier Exit, Twoje ostateczne narzędzie do optymalizacji wyjść z transakcji z precyzją i pewnością.
Ten wskaźnik dynamicznie oblicza punkty stop-loss na podstawie najwyższego maksimum i ATR, dostarczając wyraźne wskazówki wizualne na Twoim wykresie w czasie rzeczywistym.
Zaprojketowany, aby pomóc Ci zabezpieczyć zyski i chronić przed odwróceniami rynku, Chandelier Exit zapewnia, że zawsze będziesz o krok przed innymi.
Idealny dla traderów chcących ulepszyć swoją strategię za pomocą niezawodnych sygnałów wyjścia, ten wskaźnik oferuje prostą, wizualną metodę zarządzania ryzykiem. Ulepsz swój zestaw narzędzi handlowych i zabezpiecz swoje zyski dzięki Chandelier Exit.
Podsumowanie
Podsumowanie AI
The Chandelier Exit indicator dynamically calculates stop-loss levels based on the highest high price and the Average True Range (ATR). It provides real-time visual cues on trading charts to help traders optimize exit points, lock in profits, and protect against market reversals. Suitable for various markets including Forex, cryptocurrencies, stocks, commodities, and indices, it supports symbols such as BTCUSD, EURUSD, GBPUSD, XAUUSD, NAS100, and USDJPY. The indicator offers a straightforward, visual method for managing risk and enhancing trading strategies by signaling reliable exit points.
Profil wskaźnika
Opinie klientów
4.3
Opinie: 3
5 | 33 % | |
4 | 67 % | |
3 | 0 % | |
2 | 0 % | |
1 | 0 % |
Opinie klientów
October 9, 2025
Decent tool for testing if the trader wants it keeps trade control closer to the plan. It works best as support, not a final decision maker. The best use is 1 percent risk per trade, BE after 1R and partials near 1.5R. incorrect settings can give a false sense of safety.
October 8, 2025
October 8, 2025
Useful extra check for traders who care about risk before entries. It gives value around risk management, but incorrect settings can give a false sense of safety. I would check 30 trades and compare DD before and after the tool, aiming for less than 3 percent monthly DD. It is useful when the trader already respects stops and sizing.
Dyskusja
Częste pytania
BTCUSD
Forex
Signal
Indices
EURUSD
Commodities
GBPUSD
NZDUSD
Prop
Scalping
Crypto
Stocks
XAUUSD
NAS100
ATR
USDJPY
Produkty dostępne za pośrednictwem cTrader Store, w tym boty handlowe, wskaźniki i wtyczki, dostarczane są przez deweloperów zewnętrznych i udostępniane wyłącznie w celach informacyjnych oraz w celu zapewnienia dostępu technicznego. cTrader Store nie jest brokerem i nie zapewnia doradztwa inwestycyjnego, nie udziela spersonalizowanych rekomendacji ani nie gwarantuje przyszłych wyników.


Cena
Od 25/09/2025
25
Sprzedaż
316
Bezpłatne instalacje