
Mô tả
Pinescritlabs
Chỉ báo Ctrader Store: 🤖Pinescritlabs Ctrader Store cBots:
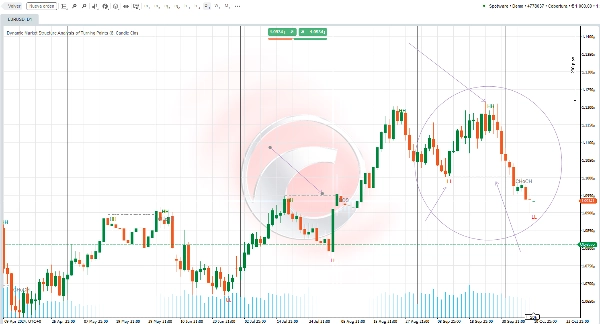
Phiên Fair Value Gap Điểm xoay Phá vỡ Vàng & BTC(mới)
Cấu trúc Thị trường Động
Phân tích Điểm Quay
Fibonacci Tuyến tính
Hồi quy Đa khung thời gian
Khoảng cách Giá trị Công bằng Động lực
Định hướng Nến Đa cấp
Theo dõi
Đường Hỗ trợ và
Kháng cự Xu hướng Tự động
Tổng quan Cài đặt Chỉ báo 🌟
ĐỘ DÀI SWING 📏
Tham số này xác định số thanh được xem xét bên trái và bên phải khi tìm điểm swing. Giá trị thấp hơn sẽ hiển thị nhiều điểm hơn, trong khi giá trị cao hơn sẽ giảm số lượng điểm. Khuyến nghị điều chỉnh tham số này dựa trên phong cách giao dịch của bạn và khi chuyển đổi giữa các khung thời gian khác nhau.
CHOCH 🔄
Bật tùy chọn này sẽ đổi tên phá vỡ xu hướng ngược đầu tiên thành CHoCH (Thay đổi Tính cách), chỉ ra khả năng thay đổi hướng thị trường.
HH và LL 📈📉
Chỉ báo sẽ vẽ các điểm swing cao (HH) và điểm swing thấp (LL) trên biểu đồ, giúp bạn hình dung cấu trúc thị trường hiệu quả hơn.
BOS ⚡
Chỉ báo cũng sẽ hiển thị các mức Phá vỡ Cấu trúc (BOS) khi phát hiện các đột phá tại điểm swing, cung cấp thêm thông tin về động lực thị trường.
Tóm tắt
Đánh giá của khách hàng
5 | 33 % | |
4 | 67 % | |
3 | 0 % | |
2 | 0 % | |
1 | 0 % |


