
Opis
📊 TrendHeikinMultiMA – Zaawansowany algorytm trendu
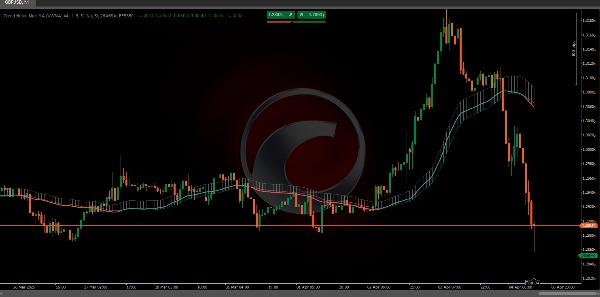
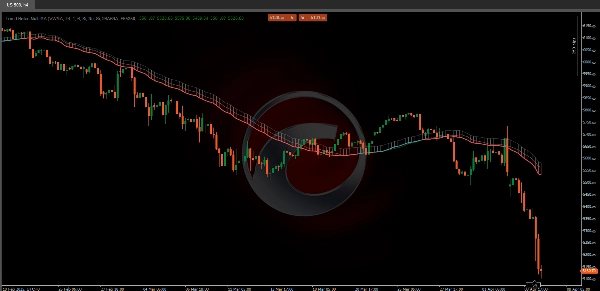
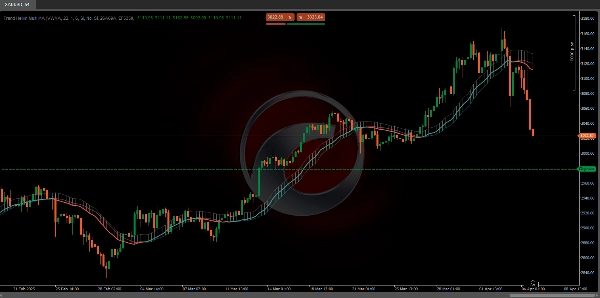
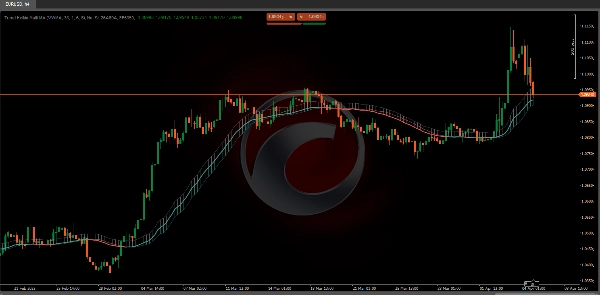
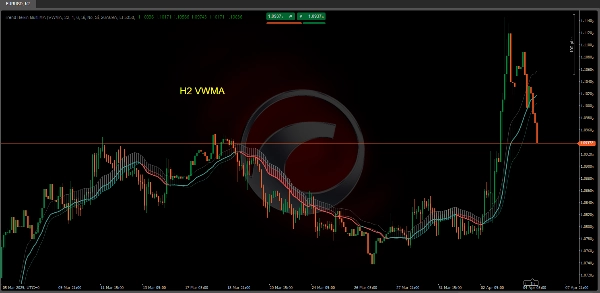
Algorytm TrendHeikinMultiMA został zaprojektowany do obliczania wartości trendu na podstawie danych cenowych, wykorzystując formułę Heikin-Ashi do wygładzania tych wartości oraz stosując różne typy średnich kroczących (ALMA, HMA, SMA, SWMA, VWMA, WMA, ZLEMA lub EMA).
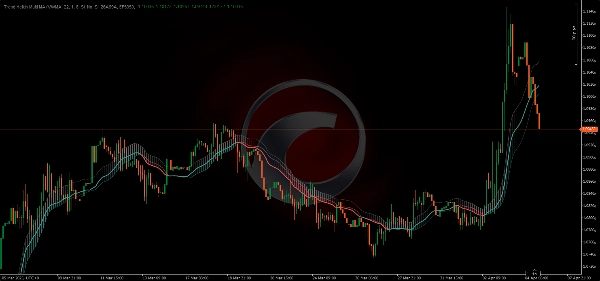
Chociaż wartości Heikin-Ashi są używane wewnętrznie, wykres nie wyświetla tradycyjnych świec Heikin-Ashi. Zamiast tego rysuje linie trendu oparte na wygładzonych wartościach, co ułatwia interpretację kierunku rynku bez wizualnej złożoności wykresów świecowych.
🔄 1. Rola wygładzania
Ponieważ wartości trendu pochodzą z wygładzania Heikin-Ashi połączonego ze średnią kroczącą, zmiana koloru w TrendHeikinMultiMA nie następuje natychmiast, gdy cena przecina linię trendu:
- 🔹 Cena może tymczasowo poruszać się powyżej lub poniżej linii trendu bez wywoływania zmiany koloru.
- 🔹 Dzieje się tak, ponieważ wskaźnik czeka na znaczącą i trwałą różnicę między wygładzonymi wartościami otwarcia i zamknięcia, aby potwierdzić rzeczywistą zmianę trendu.
✅ Zaleta w interpretacji
To celowe opóźnienie w zmianie koloru pomaga unikać fałszywych sygnałów. W tradycyjnym wykresie świecowym cena może chwilowo przeciąć linię trendu i wywołać przedwczesne sygnały.
- 🟥 Na przykład, nawet jeśli aktualna cena jest powyżej linii trendu spadkowego, wskaźnik pozostanie czerwony (spadkowy), dopóki wygładzone wartości nie potwierdzą, że zamknięcie jest konsekwentnie wyższe niż otwarcie.
- 🟩 Podobnie, aby przełączyć się na zielony (wzrostowy), średnia krocząca oparta na Heikin-Ashi musi potwierdzić, że zamknięcie konsekwentnie przekracza otwarcie.
📈 2. Zastosowanie średnich kroczących do wartości Heikin-Ashi
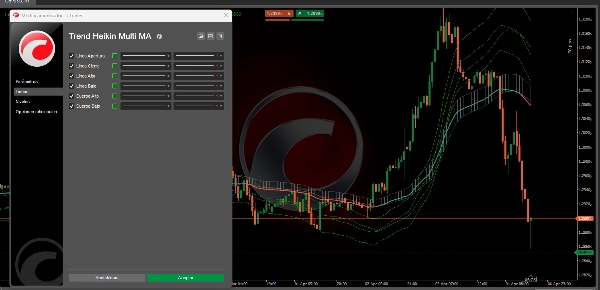
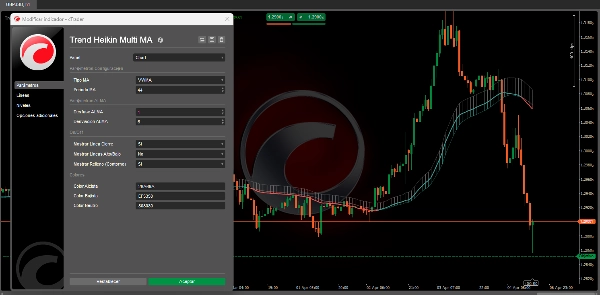
- 🔄 Wybór średniej kroczącej:
-
- Użytkownik może wybrać spośród różnych typów średnich kroczących (ALMA, HMA, SMA, SWMA, VWMA, WMA, ZLEMA i EMA).
- Każdy typ MA stosuje określoną metodę matematyczną do ważenia i wygładzania historycznych wartości otwarcia, zamknięcia, maksimum i minimum pochodzących z Heikin-Ashi.
🏆 3. Zalety używania TrendHeikinMultiMA w porównaniu z tradycyjnymi świecami
- 📉 Redukcja szumów:
-
- Tradycyjne świece często pokazują wysoką zmienność i rozproszone dane, co utrudnia identyfikację ogólnego trendu.
- TrendHeikinMultiMA wygładza te dane, filtrując drobne fluktuacje i eliminując nagłe wahania, pozwalając traderom skupić się na głównym kierunku rynku.
✅ Podsumowanie
Podsumowując, TrendHeikinMultiMA potwierdza zmianę trendu (wzrostowego lub spadkowego) tylko wtedy, gdy wygładzone wartości otwarcia i zamknięcia—obliczone na podstawie Heikin-Ashi i przetworzone przez wybraną średnią kroczącą—konsekwentnie pokazują, że zachowanie rynku zmieniło kierunek.
To zapewnia, że sygnały są bardziej wiarygodne i mniej podatne na szumy widoczne na tradycyjnych wykresach świecowych. 🚀📊
🔥 Wskaźniki Pinescritlabs Ctrader Store 🔥
Dynamic Market Structure
Analiza punktów zwrotnych
Fibonacci Linear
Regresja wieloczasowa
Multi-Level Candle Bias
Tracker
Auto Support and
Resistance Trend Lines
All Support and
Resistance Levels
Podsumowanie
The indicator incorporates a smoothing mechanism that delays color changes to confirm trend reversals only after a significant and sustained difference between smoothed open and close values is detected. This approach reduces false signals caused by brief price fluctuations crossing trend lines.
Users can select from multiple moving average types, each applying distinct mathematical weighting methods to the Heikin-Ashi-derived open, close, high, and low values, enhancing customization and adaptability to different trading styles.
Compared to traditional candlestick charts, Trend Heikin Multi MA filters out minor price fluctuations and abrupt swings, allowing traders to focus on primary market trends with more reliable signals. It confirms bullish or bearish trend changes only when smoothed values consistently indicate a market direction reversal, improving signal accuracy and reducing noise.
Opinie klientów
5 | 33 % | |
4 | 67 % | |
3 | 0 % | |
2 | 0 % | |
1 | 0 % |


