
Opis
🚀 Ponad 10 000 traderów już korzysta z naszych NAJLEPSZYCH wskaźników🏆
Dowiedz się, dlaczego profesjonaliści wybierają nas – najpotężniejsze narzędzia na cTrader (wskaźniki, algorytmy i cBoty) czekają na Ciebie.
👉 Pobierz wszystkie nasze NAJLEPSZE systemy tutaj:
_______________________________________________
_______________________________________________
📌 Wskaźniki Struktury Rynku
· ✅ AdvancedMarket Structure: Bos, Choch, SwinLevels, Order Blocks, Market Structure& Liquidity Finder
· 🔄 Dynamic Market StructureAnalysis of Turning Points
· 🧱 Order Block
· ⚖️ Market Imbalance
· ⛓️ BOS & CHOCH
· 🧠 ICT Power of 3
______________________________________________________________-
Sklep cBotów : 🧠 Gold & BTC BreakoutSession Pivots 🧠
_______________________________________________
🔚 Inteligentne Systemy Wyjścia
_______________________________________________
📐 Wskaźniki ZigZag
· 🔍 ZigZag Price LiquidityProjection
· ➖ ZigZag
_______________________________________________
🧱 Wskaźniki Wsparcia i Oporu
· 🟩 SmartTrend Support &Resistance Lines
· 🧱 All Support and ResistanceLevels
_______________________________________________
📊 Wskaźniki Trendu i Kanału
· 📊 Supertrend
_______________________________________________
💧 Narzędzia Wolumenu i Płynności
_______________________________________________
⚡ Wskaźniki Momentum i RSI
· 🔎 Multi-Level Candle BiasTracker
_______________________________________________
🔮 Narzędzia Prognozowania i Projekcji
· 📐 Prediction Based on Linreg& ATR
· 📏 Fibonacci Linear RegressionMulti-timeframe
· 📈 Volume-Powered Market Flow Projector
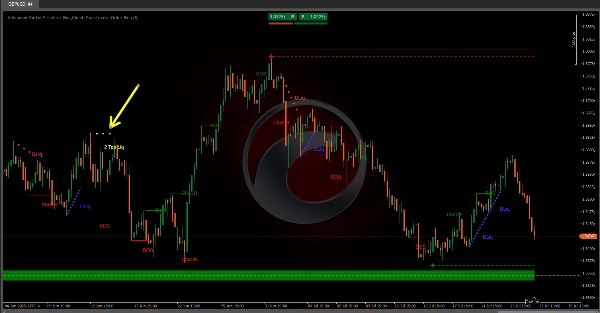
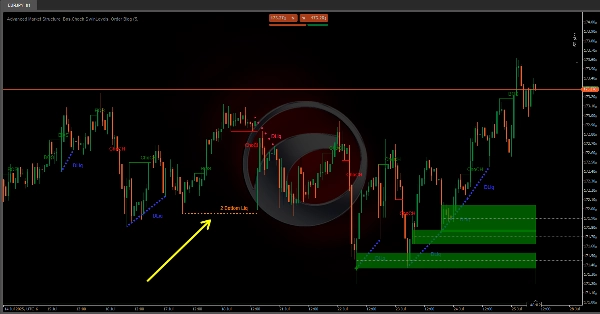
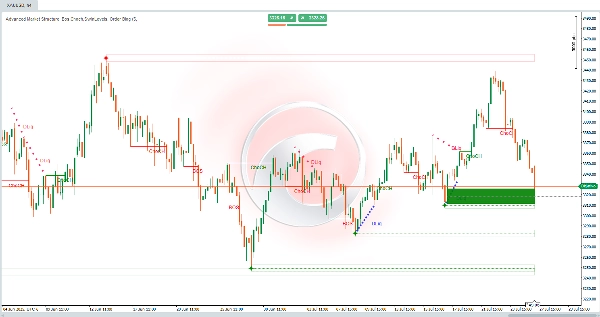
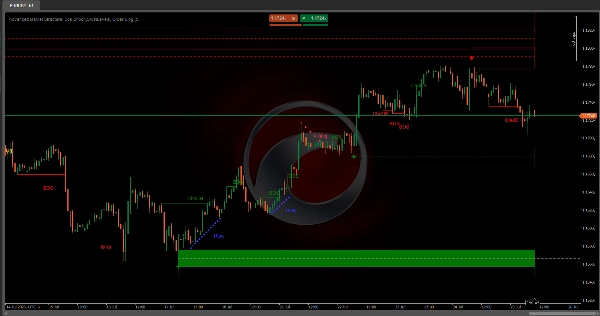
Advanced Market Structure: Bos, Choch, SwinLevels, Order Blocks, Market Structure & Liquidity Finder.
Co to jest?
Zaawansowane narzędzie price action łączące wiele koncepcji analizy technicznej w jeden potężny wskaźnik. Integruje:
- 📊 Strukturę Rynku
- 🔄 Poziomy Swing
- 🧱 Order Blocki
- 💧 Liquidity Finder (2 dołki & 2 szczyty)
Cel: Identyfikacja kluczowych punktów wejścia/wyjścia, trendów, wsparć/oporów oraz stref instytucjonalnych, gdzie cena reaguje.
🧠 Główna filozofia: Smart Money
Rynkami kierują instytucjonalni gracze (banki, fundusze, market makerzy) dysponujący przewagą zasobów. Tworzą wzorce, aby:
- 🕵️♂️ Ukryć operacje podczas akumulacji/dystrybucji.
- 🎯 Polować na płynność (stop lossy detalicznych).
- 🚀 Napędzać gwałtowne ruchy na niezrównoważonych rynkach.
🔑 Składniki:
1. Order Blocki
- Co to jest: Strefy, gdzie instytucje realizowały masowe zlecenia, tworząc nierównowagi.
- Typy:
-
- 🟢 Bycze (Popyt): Agresywne zakupy instytucjonalne.
- 🔴 Niedźwiedzie (Podaż): Agresywna sprzedaż instytucjonalna.
- Kluczowy sygnał: Odbicie/odwrócenie ceny na order blockach.
- Wykrywanie:
-
- Wzrosty wolumenu w pobliżu szczytów (niedźwiedzie) lub dołków (bycze).
2. Poziomy Swing
- Cel: Definiowanie struktury rynku przez kluczowe szczyty/dołki.
- Krytyczne przełamania:
-
- 🔺 Przełamanie Swing High: Kontynuacja bycza.
- 🔻 Przełamanie Swing Low: Kontynuacja niedźwiedzia.
3. Przełamanie Struktury (BoS)
- Definicja: Decydujące przełamanie swingowych szczytów (bycze) lub dołków (niedźwiedzie).
- Połączenie fraktalne:
-
- 🐂 Fraktal byczy: Wzór 5 świec z centralnym najniższym dołkiem.
- 🐻 Fraktal niedźwiedzi: Wzór 5 świec z centralnym najwyższym szczytem.
4. Zmiana Charakteru (ChoCh)
- Definicja: Zmiana strukturalna sygnalizująca odwrócenie trendu.
- Wyzwalacze:
-
- Przełamanie swingowych dołków w trendzie wzrostowym (niedźwiedzi ChoCh).
- Przełamanie swingowych szczytów w trendzie spadkowym (byczy ChoCh).
5. Strefy Płynności
- Typy:
-
- ⚖️ Statyczne: Poziomy poziome z zagęszczonymi szczytami/dołkami (filtrowane ATR).
- 🏃 Dynamiczne: Linie trendu łączące strome pivoty.
- Kluczowe wzorce:
-
- 🕯️ 2 szczyty/2 dołki: Polowania na stop lossy instytucji.
- ⛰️ Potrójne szczyty/dołki: Strefy wysokiej kongestii.
🎯 Kluczowe zastosowania
- ✅ Identyfikacja trendów/odwróceń za pomocą BoS/ChoCh.
- 📍 Lokalizacja wsparć/oporów przy użyciu poziomów swing i stref płynności.
- 🏦 Wykrywanie instytucjonalnych order blocków.
- 🎯 Prognozowanie celów cenowych przez strefy płynności.
🔄 Strategie Smart Money
FazySygnałyDziałania Instytucji
1. Akumulacja
Byczy ChoCh + Demand order block 📈
Smart Money kupuje
2. Markup
Kolejne BoS + luki FVG 🚀
Detaliści napędzają momentum
3. Dystrybucja
Niedźwiedzi ChoCh przy 2 Top Liquidity 🎯
Smart Money sprzedaje
4. Markdown
Niedźwiedzi BoS + likwidacja strefy rabatowej 🔻
Polowania na stop lossy przy dołkach
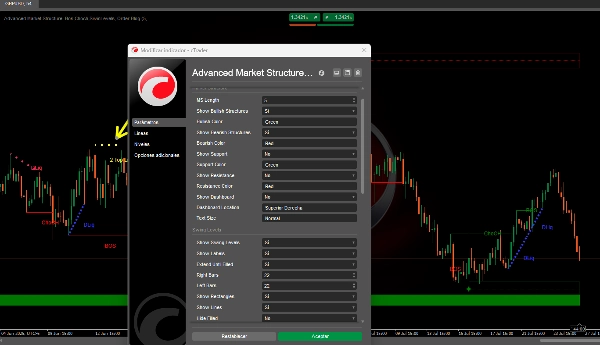
⚙️ Przewodnik po dostrajaniu parametrów
Struktura Rynku
Długość MS:-
- ⬆️ Zwiększ: Mniej, ale bardziej wiarygodnych fraktali.
- ⬇️ Zmniejsz: Bardziej czuły (ryzyko szumu).
Poziomy Swing
SwingSizeL/R:-
- ⬆️ Zwiększ: Identyfikuje znaczące swingi.
- ⬇️ Zmniejsz: Wykrywa drobne odwrócenia.
Extend Until Filled:-
- ✅ Włączone: Poziomy utrzymują się, dopóki cena ich nie osiągnie.
Order Blocki
Metoda łagodzenia:-
- ✨
Knock: Szybsze sygnały (dotyka knota). - 🎯
Zamknięcie: Silniejsze sygnały (zamyka się poza blokiem).
- ✨
Liquidity Finder
Czułość statyczna/dynamiczna:-
- ⬆️ Zwiększ: Mniej stref (wyższa jakość).
- ⬇️ Zmniejsz: Więcej stref (wyższa czułość).
Podsumowanie
Key components include:
- **Order Blocks:** Zones of significant institutional buying (bullish) or selling (bearish) identified by volume spikes near highs or lows, signaling potential price rebounds or reversals.
- **Swing Levels:** Critical highs and lows defining market structure, with breaks indicating bullish or bearish continuations.
- **Break of Structure (BoS):** Decisive breaks of swing highs or lows, linked to fractal patterns, signaling trend direction.
- **Change of Character (ChoCh):** Structural shifts indicating trend reversals, triggered by breaking swing lows in uptrends or swing highs in downtrends.
- **Liquidity Zones:** Static (horizontal levels with clustered highs/lows) and dynamic (trendlines connecting pivots) zones highlighting institutional stop hunts and congestion areas.
The indicator supports smart money concepts, reflecting institutional market behavior phases: Accumulation, Markup, Distribution, and Markdown. Parameter tuning options allow adjustment of sensitivity and signal strength for Market Structure, Swing Levels, Order Blocks, and Liquidity Finder components. This tool aims to enhance market analysis by revealing institutional activity and improving trade decision-making.
Opinie klientów
5 | 33 % | |
4 | 67 % | |
3 | 0 % | |
2 | 0 % | |
1 | 0 % |


