Opis
Perfect Entry Price to wskaźnik nowej generacji zaprojektowany, aby pomóc traderom zidentyfikować najdokładniejsze i najbardziej wiarygodne poziomy cenowe do wejść na rynek.
Automatycznie skanuje strukturę rynku, dynamikę wolumenu oraz zachowanie ceny, aby zlokalizować strefy, w których najprawdopodobniej nastąpi odwrócenie lub kontynuacja.
Wskaźnik jest idealny dla traderów, którzy chcą wejść na rynek dokładnie wtedy, gdy prawdopodobieństwo jest najwyższe, a ryzyko najniższe — niezależnie czy skalpujesz, handlujesz dziennie, czy swingujesz.
Jak to działa (Uproszczone wyjaśnienie)
Wskaźnik nieustannie analizuje najnowsze dane rynkowe, aby ocenić, gdzie instytucjonalni traderzy mogli wejść lub zareagować na cenę.
Mierzy kilka czynników technicznych i behawioralnych, aby wygenerować „Najlepszy Poziom Wejścia”.
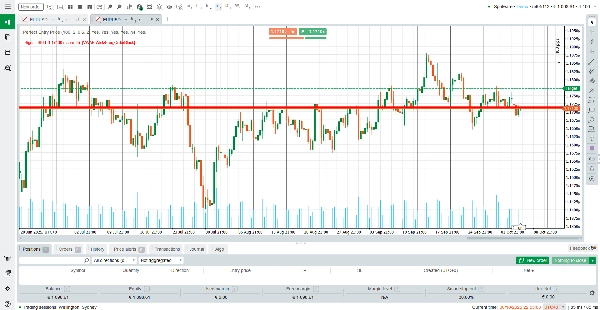
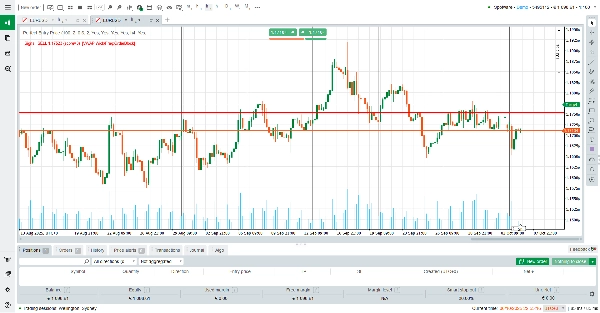
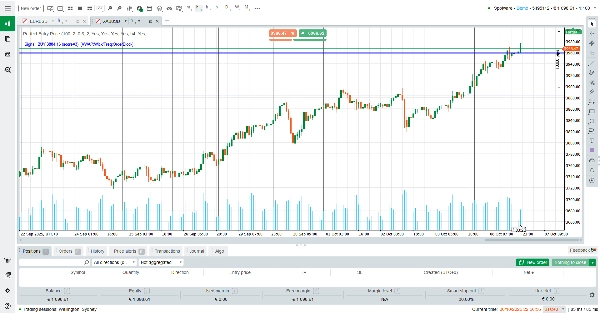
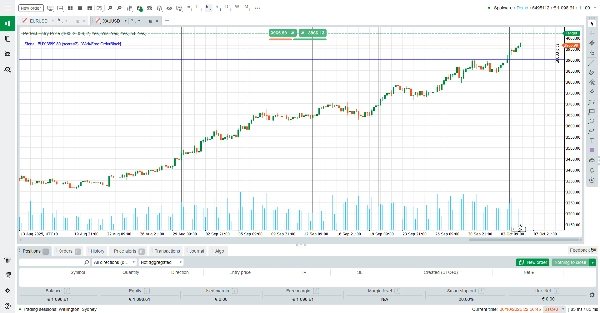
Po wykryciu poziom jest automatycznie rysowany jako kolorowa linia pozioma na Twoim wykresie:
🔵 Niebieska linia – sugeruje potencjalną strefę wejścia na zakup
🔴 Czerwona linia – sugeruje potencjalną strefę wejścia na sprzedaż
Gdy pojawi się ważny sygnał, w lewym górnym rogu wykresu pojawi się komunikat pokazujący:
Znaleziono sygnał — KUP (lub SPRZEDAJ) po [cena] wraz z krótkim wyjaśnieniem użytych czynników potwierdzających.
Jeśli zobaczysz komunikat „Brak sygnału” czarnym tekstem, oznacza to, że obecnie nie ma silnego punktu wejścia dla tego interwału czasowego.
W takim przypadku po prostu przełącz się na inny interwał (na przykład z M5 na M15 lub H1), aby odświeżyć i ponownie przeanalizować strukturę rynku.
Logika jest adaptacyjna i przelicza się ciągle w czasie rzeczywistym — co oznacza, że każdy tick ponownie ocenia warunki rynkowe dla maksymalnej precyzji.
Jak czytać wskaźnik
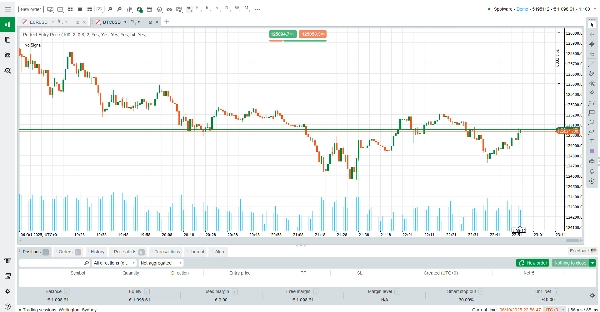
Czekaj na sygnał — pojawi się komunikat „KUP” lub „SPRZEDAJ” wraz z linią poziomą.
Obserwuj zachowanie ceny — obserwuj, jak cena reaguje, gdy zbliża się do oznaczonego poziomu.
Używaj potwierdzeń — jeśli chcesz, połącz to z własnymi narzędziami konfluencji (linie trendu, RSI, wolumen itp.).
Brak sygnału? — żółty tekst „Brak sygnału” oznacza, że warunki nie są jeszcze idealne; spróbuj innego interwału czasowego.
Ciesz się przejrzystością — wszystkie linie są automatycznie aktualizowane i zarządzane; nie jest potrzebne ręczne rysowanie.
Kluczowe cechy
Inteligentne wykrywanie wejścia — wykorzystuje zaawansowaną ocenę wieloczynnikową, aby zlokalizować najbardziej prawdopodobną cenę wejścia.
Potwierdzenie na wyższych interwałach — automatycznie sprawdza zgodność trendu na wielu interwałach dla większej dokładności.
Automatyczna aktualizacja poziomów — wszystkie przestarzałe linie są usuwane i zastępowane automatycznie, aby utrzymać wykres w czystości.
Adaptacyjna logika w czasie rzeczywistym — stale przelicza się na podstawie najnowszych danych rynkowych, a nie tylko przeszłych słupków.
Wyraźne wizualne alerty — wyświetla powiadomienia tekstowe bezpośrednio na wykresie dla natychmiastowej świadomości.
Dlaczego warto wybrać Perfect Entry Price
W przeciwieństwie do typowych generatorów wsparcia/oporu czy sygnałów, Perfect Entry Price skupia się na dokładnym poziomie, na którym profesjonalne pieniądze najprawdopodobniej zadziałają.
Filtruje słabe obszary i podkreśla tylko te z wieloma potwierdzeniami, dając traderom pewność do zdecydowanego działania.
Brak mylących parametrów — po prostu załaduj wskaźnik, obserwuj wykres i handluj najlepszymi okazjami z niezrównaną precyzją.
Podsumowanie
Key features include multi-factor evaluation for smart entry detection, higher-timeframe trend confirmation, automatic updating and removal of outdated levels, and continuous real-time recalculation for precision. The indicator supports various markets including Forex, cryptocurrencies, commodities, indices, and stocks. It is suitable for scalping, day trading, and swing trading styles. Perfect Entry Price focuses on levels where institutional traders are likely active, filtering out weaker signals to assist traders in making informed entry decisions without manual drawing or complex parameter settings.
Opinie klientów
5 | 100 % | |
4 | 0 % | |
3 | 0 % | |
2 | 0 % | |
1 | 0 % |