
Daily Open Color Zones
Wskaźnik
345 pobrania
Wersja 1.0, Sep 2025
Windows, Mac
4.0
Opinie: 1
Opis
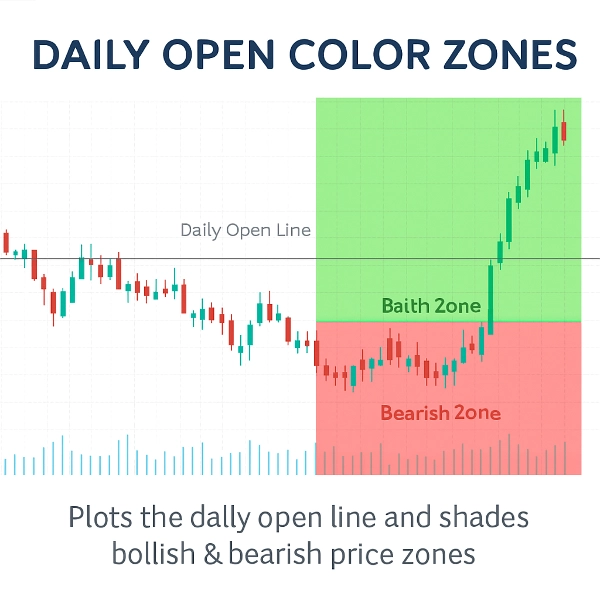
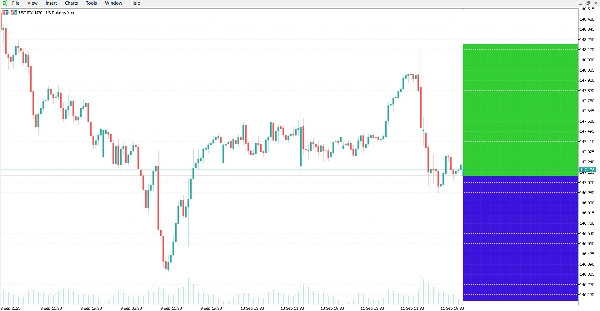
Ten wskaźnik rysuje linię otwarcia dnia i zacienia wokół niej bycze oraz niedźwiedzie strefy cenowe.
Zapewnia wyraźny wizualny punkt odniesienia, aby zobaczyć, czy rynek handluje powyżej czy poniżej otwarcia dnia, które jest powszechnie używanym poziomem w analizie intraday.
Wskaźnik automatycznie rysuje linię poziomą na cenie otwarcia dnia i podświetla obszary wykresu:
- Zielona strefa powyżej linii (obszar byczy).
- Czerwona strefa poniżej linii (obszar niedźwiedzi).
Funkcje:
- Automatyczna linia otwarcia dnia: precyzyjne rysowanie ceny otwarcia dnia.
- Strefy kolorów: łatwe rozróżnienie obszarów byczych i niedźwiedzich dzięki konfigurowalnym kolorom.
- Dynamiczne aktualizacje: strefy dostosowują się automatycznie z każdą nową świecą.
- Konfigurowalny wygląd: można zmieniać styl linii, grubość i kolory stref.
- Lekki i wydajny: zaprojektowany z myślą o minimalnym zużyciu CPU.
- Działa na wszystkich symbolach i ramach czasowych.
Podsumowanie:
Wskaźnik oferuje wyraźną wizualizację wykresu otwarcia dnia oraz powiązanych stref byczych/niedźwiedzich. Może być stosowany na różnych rynkach i ramach czasowych do analizy technicznej.
Podsumowanie
Podsumowanie AI
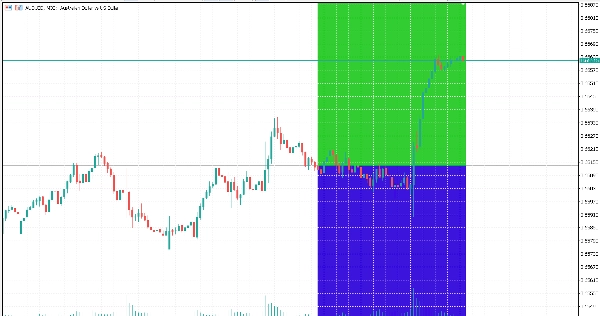
The Daily Open Color Zones indicator visually marks the daily open price on trading charts by automatically plotting a horizontal line at this level. It shades the price area above the daily open line in green to indicate bullish zones and the area below in red to indicate bearish zones. These color-coded zones update dynamically with each new candle, providing real-time visual cues about market direction relative to the daily open. The indicator supports all symbols and timeframes, making it applicable across various markets including Forex, cryptocurrencies, and commodities like gold (XAUUSD). Users can customize the line style, thickness, and zone colors to suit their preferences. Designed to be lightweight, it minimizes CPU usage while offering clear intraday reference points commonly used in technical analysis and scalping strategies.
Profil wskaźnika
Opinie klientów
4.0
Opinie: 1
5 | 0 % | |
4 | 100 % | |
3 | 0 % | |
2 | 0 % | |
1 | 0 % |
Opinie klientów
October 20, 2025
Clean and visual 🎨 - Daily Open Zones make trend bias crystal clear. Great tool for intraday planning and momentum entries!
Dyskusja
Częste pytania
Forex
Scalping
EURUSD
Crypto
Grid
XAUUSD
Produkty dostępne za pośrednictwem cTrader Store, w tym boty handlowe, wskaźniki i wtyczki, dostarczane są przez deweloperów zewnętrznych i udostępniane wyłącznie w celach informacyjnych oraz w celu zapewnienia dostępu technicznego. cTrader Store nie jest brokerem i nie zapewnia doradztwa inwestycyjnego, nie udziela spersonalizowanych rekomendacji ani nie gwarantuje przyszłych wyników.


![Logo „[Hamster-Coder] Pivot Points MTF”](https://cdn.ctrader.com/image/webp/4c143e5a-309c-40e3-a578-f04d1e133ffa_31159)


Cena
Od 13/09/2025
27
Sprzedaż
5.38K
Bezpłatne instalacje