
H4 Range - JR
Indikator
146 downloads
Version 1.0, Jun 2026
Windows, Mac
5.0
Bewertungen: 2

Seit 11/02/2026
18
Verkäufe
344
Kostenlose Installationen
Beschreibung
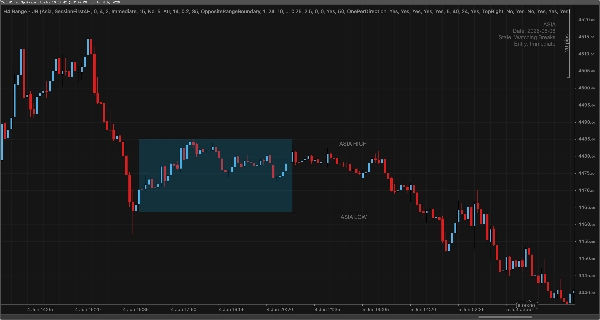
Indikator, der einen 4H-Bereich in eine klare, strukturierte Handelskarte mit mehreren Setup-Modellen verwandelt.
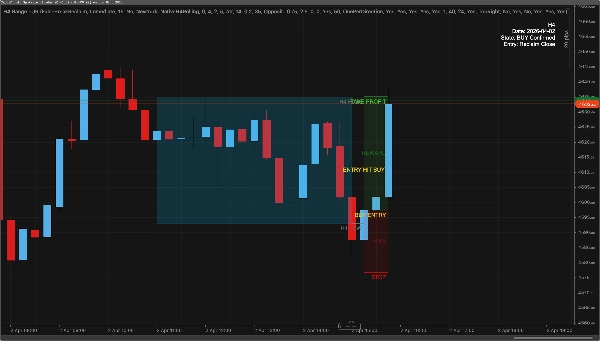
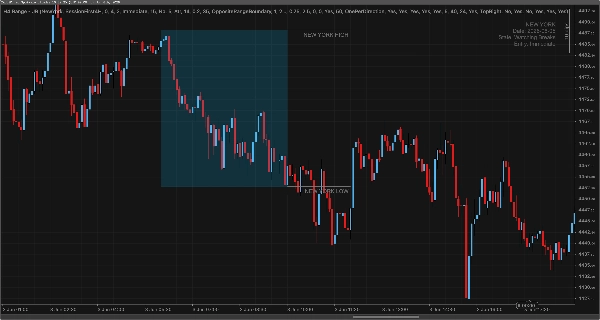
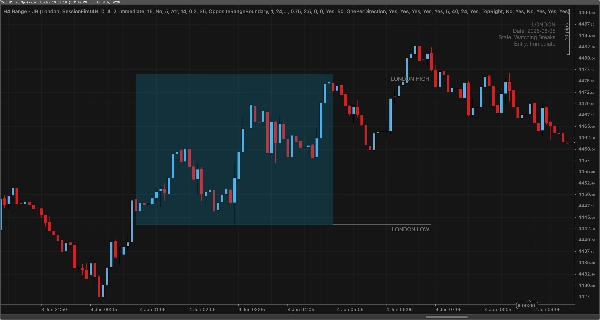
Der Indikator erstellt den aktiven 4H-Bereich als gefüllte Zonenbox und beobachtet dann den Preis auf einen Kerzenschluss außerhalb seines Hochs oder Tiefs. Von dort aus können Sie wählen, wie der Handel ausgelöst werden soll.
🏷️ Setup-Modell
FalseBreakReclaim- Handel des fehlgeschlagenen Ausbruchs, nachdem der Preis wieder innerhalb des Bereichs geschlossen hat.BreakoutRetest- Handel der Fortsetzung nach einem gültigen Ausbruch und Retest der durchbrochenen Grenze.BreakoutClose- Handel des Schlusskurses der Ausbruchskerze selbst in Richtung des Ausbruchs.
Jedes bestätigte Signal wird im Chart mit Entry-, Stop- und Take-Profit-Leveln dargestellt.
🏷️ Bereichsquellen-Modi
SessionFirst4H- der erste 4H-Block der ausgewählten Sitzungsvoreinstellung (NewYork, London, Asia, Custom).NativeH4Rolling- jede geschlossene Broker-H4-Kerze wird zu einem frischen Bereich, mit Signalen, die während des folgenden H4-Zeitraums gesucht werden.
🏷️ Hauptfunktionen
- Gefüllte 4H-Bereichs-Zonenbox mit dynamischen Hoch- und Tief-Linien.
- KAUF- und VERKAUF-Einstiegssignale basierend auf Reclaim-, Retest- oder Breakout-Close-Logik.
- Konfigurierbarer Stop-Puffer (feste Pips oder ATR) und Zielmodus (FixedRR, gegenüberliegende Grenze, Bereichsmitte oder ATR-Multiplikator).
- Kompaktes Dashboard.
- Optionale Bereichsqualität, False-Break-Qualität, höheres Zeitrahmen-Bias, optionaler 4H EMA-Trendfilter
- Popup- und Sound-Benachrichtigungen für HIGH BREAK, LOW BREAK und ENTRY-Ereignisse.
🏷️ Schutz & Filter
- 4H EMA Trend: Steigungs-Schutz, um sicherzustellen, dass Fortsetzungs-Setups (BreakoutRetest/Close) mit dem Haupt-4H-Trend übereinstimmen.
- Tägliches Bias: Optionaler Filter zur Synchronisation der Signale mit dem Tagestrend (EMA/RSI) oder einer manuellen Bias-Überschreibung.
- Bereichsqualität: Mindestvolatilitätsanforderungen, um das Trading in stagnierenden oder „flachen“ 4H-Bereichen zu vermeiden.
- Sweep & Displacement: Stellt sicher, dass Reclaims ausreichende Tiefe (Sweep) und Stärke (Reclaim-Körper/Displacement) haben.
- Handelslimits: Limits pro Sitzung (z. B. 1 Trade pro Richtung), um Überhandel während volatiler Zyklen zu verhindern.
Dieser Indikator dient nur zur Analyse. Er platziert keine Trades. Testen Sie immer auf einem Demokonto, bevor Sie live gehen.
Zusammenfassung
AI summary
H4 Range - JR is a trading indicator that constructs an active 4-hour price range as a filled zone on the chart, highlighting dynamic high and low boundaries. It monitors price action for candle body breaks beyond this range and provides three configurable trade setup models: FalseBreakReclaim (trading failed breaks when price closes back inside the range), BreakoutRetest (trading continuation after a breakout and retest), and BreakoutClose (trading the breakout candle close direction). The indicator projects entry, stop-loss, and take-profit levels for each confirmed signal.
Users can select between two range source modes: SessionFirst4H, which uses the first 4-hour block of a chosen session (New York, London, Asia, or custom), and NativeH4Rolling, which resets the range with each closed 4-hour candle. Core features include configurable stop buffers (fixed pips or ATR), multiple target modes (fixed risk-reward, opposite boundary, range midpoint, or ATR multiple), a compact dashboard, and optional filters such as range quality, false-break quality, higher timeframe bias, and a 4H EMA trend filter.
Additional guards and filters help align trades with major trends and control trade frequency, including 4H EMA slope, daily bias filters, minimum volatility requirements, sweep and displacement criteria, and per-session trade limits. The indicator supports visual signals and alerts for high break, low break, and entry events. It is designed for analysis and does not execute trades automatically.
Users can select between two range source modes: SessionFirst4H, which uses the first 4-hour block of a chosen session (New York, London, Asia, or custom), and NativeH4Rolling, which resets the range with each closed 4-hour candle. Core features include configurable stop buffers (fixed pips or ATR), multiple target modes (fixed risk-reward, opposite boundary, range midpoint, or ATR multiple), a compact dashboard, and optional filters such as range quality, false-break quality, higher timeframe bias, and a 4H EMA trend filter.
Additional guards and filters help align trades with major trends and control trade frequency, including 4H EMA slope, daily bias filters, minimum volatility requirements, sweep and displacement criteria, and per-session trade limits. The indicator supports visual signals and alerts for high break, low break, and entry events. It is designed for analysis and does not execute trades automatically.
Indikatorprofil
Indikatorkategorie
Unterstützung und Widerstand
Ausgabetyp
Visualisierung
Signale
Datenanforderungen
Nur Balken
Unterstützte Signale
Ausbruch
Wendepunkt
Level – Durchbrechen
Level – Berührung
Eröffnungsspanne der Sitzung
Kundenbewertungen
5.0
Bewertungen: 2
5 | 100 % | |
4 | 0 % | |
3 | 0 % | |
2 | 0 % | |
1 | 0 % |
Kundenbewertungen

July 19, 2026
H4 Range is a highly versatile setup generator that transforms 4H ranges into structured trade maps. It offers three distinct models-FalseBreakReclaim, BreakoutRetest, and BreakoutClose-catering to different trading styles. The robust filtering system (EMA trend, sweep depth, range quality) prevents low-quality entries, while the automatic SL/TP projection keeps execution disciplined. Despite a steep learning curve due to deep customization, it’s a powerhouse tool for intraday range traders.
Diskussion
Häufig gestellte Fragen (FAQ)
Breaker Block
Key Levels
ATR
Über den cTrader Store verfügbare Produkte, einschließlich Handelsbots, Indikatoren und Plugins, werden von externen Entwicklern bereitgestellt und nur zu Informations- und technischen Zugriffszwecken verfügbar gemacht. cTrader Store ist kein Broker und erbringt keine Anlageberatung, persönlichen Empfehlungen oder eine Garantie für zukünftige Performance.



![„[Stellar Strategies] BOS Trend 1.0“-Logo](https://cdn.ctrader.com/image/webp/6cdec0f1-0e97-4a82-a8a4-2b67aed54d38_25695)















Preis
Seit 11/02/2026
18
Verkäufe
344
Kostenlose Installationen