
VegaXLR - Analysis Tools Alerts
Indikator
2 käufe
Version 1.1, Apr 2026
Windows, Mac
4.5
Bewertungen: 2
Beschreibung
cTrader Analysis Tools Alerts ist ein All-in-One-Indikator, der Ihr Charting-Erlebnis verbessert, indem er Alarme, Beschriftungen und automatische Farbkennzeichnungen zu verschiedenen Zeichenwerkzeugen hinzufügt.
Funktionen:
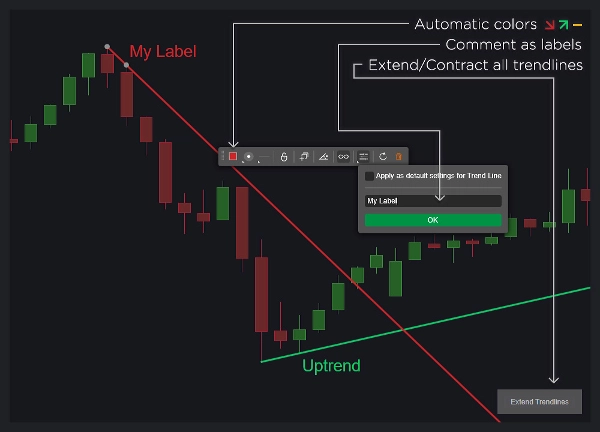
- Trendlinien:
-
- Anzeige benutzerdefinierter Beschriftungen mithilfe von Objektkommentaren.
- Dynamische Farbänderungen basierend auf der Richtung der Trendlinie.
- Option zum Entfernen von Trendlinien nach einem Alarm.
- Aktivieren oder Deaktivieren von trendlinien-spezifischen Alarmen.
- Alle Trendlinien mit einem Klick verlängern oder verkürzen.
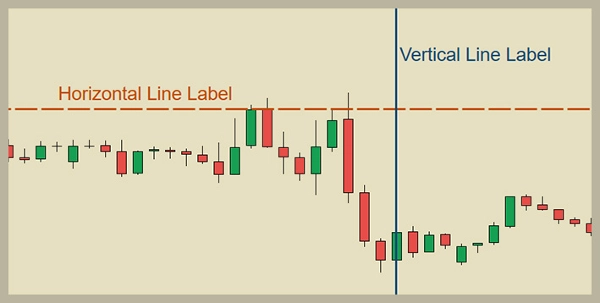
- Horizontale und vertikale Linien:
-
- Anzeige benutzerdefinierter Beschriftungen mithilfe von Objektkommentaren.
- Automatisches Löschen von Linien nach einem Alarm.
- Konfigurieren von Alarmen für jeden Linientyp.
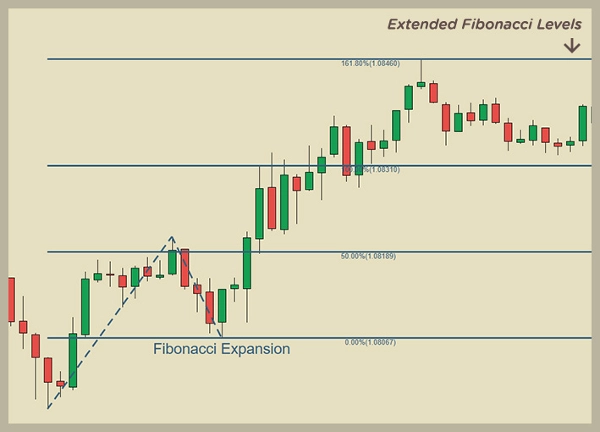
- Fibonacci-Retracement- und Expansionsniveaus:
-
- Anzeige benutzerdefinierter Beschriftungen mithilfe von Objektkommentaren.
- Automatisches Verlängern der Linien bis ins Unendliche.
- Option zum Löschen von Objekten nach einem Alarm.
- Farben basierend auf der Zeichenrichtung zuweisen.
- Aktivieren oder Deaktivieren von Alarmen für Fibonacci-Niveaus.
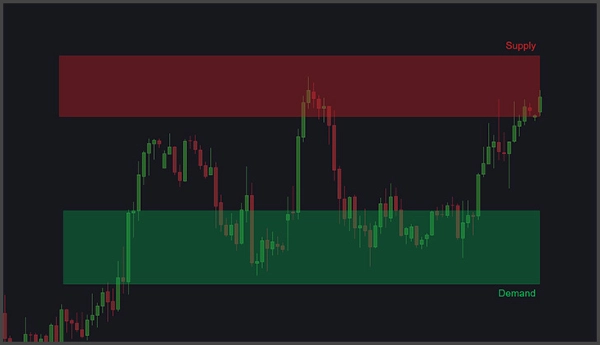
- Rechtecke (Angebots- und Nachfragebereiche):
-
- Anzeige benutzerdefinierter Beschriftungen mithilfe von Objektkommentaren.
- Alarme für Preisinteraktionen und Tick-Volumen-Spitzen.
- Parameter für Tick-Volumen-Spitzenalarme einstellen, einschließlich Rückblick-Bars, prozentualer Volumenanstieg und Pausenzeit nach Alarm.
- Automatische Rechteckfüllung und Verlängerung bis zur aktiven Kerze.
- Gesamte Anpassung:
-
- Positionen der Beschriftungen und Textgrößen für jeden Objekttyp anpassen.
- Automatische Farben anpassen.
- Objektkommentare in Alarmmeldungen einbeziehen.
- Alarme für jeden Objekttyp aktivieren oder deaktivieren.
- Alarme und Hilfe:
-
- Alarme per Ton, Pop-ups, Telegram und E-Mail erhalten.
- Automatische Chart-Screenshots werden an Telegram gesendet.
- Benutzerhandbuch über eine kleine Schaltfläche im Chart zugänglich.
Dieses Tool ist ideal für Trader, die Unterstützung und Widerstand, Angebot und Nachfrage, Fibonacci oder Trendlinien in ihren Strategien verwenden.
Zusammenfassung
KI-Zusammenfassung
VegaXLR - Analysis Tools Alerts is an all-in-one indicator for the cTrader platform that enhances chart analysis by integrating alerts, labels, and automatic color-coding with various drawing tools. It supports trendlines, horizontal and vertical lines, Fibonacci retracement and expansion levels, and rectangles representing supply and demand areas.
Key features include:
- Trendlines: Custom labels from object comments, dynamic color changes based on direction, options to remove or extend trendlines after alerts, and toggle alerts per trendline.
- Horizontal and Vertical Lines: Custom labels, automatic deletion after alerts, and configurable alerts per line type.
- Fibonacci Levels: Custom labels, infinite extension of level lines, color assignment by drawing direction, and alert enable/disable options.
- Rectangles (Supply and Demand): Custom labels, alerts for price interactions and tick volume spikes with adjustable parameters, automatic fill and extension to the active candle.
- Overall customization allows adjustment of label positions, text sizes, automatic colors, inclusion of comments in alerts, and enabling/disabling alerts per object type.
- Alerts can be received via sound, pop-ups, Telegram, and email, with automatic chart screenshots sent to Telegram.
- A user guide is accessible directly on the chart.
This tool is suited for traders employing support and resistance, supply and demand, Fibonacci, or trendline strategies.
Indikatorprofil
Indikatorkategorie
Unterstützung und Widerstand
Ausgabetyp
Visualisierung
Datenanforderungen
Nur Balken
Unterstützte Signale
Durchbrechen
Ausbruch
Level – Berührung
Level – Durchbrechen
Wendepunkt
Trendstärke
Kundenbewertungen
4.5
Bewertungen: 2
5 | 50 % | |
4 | 50 % | |
3 | 0 % | |
2 | 0 % | |
1 | 0 % |
Diskussion
Häufig gestellte Fragen (FAQ)
Fibonacci
Forex
Supply & Demand
Support & Resistance
Über den cTrader Store verfügbare Produkte, einschließlich Handelsbots, Indikatoren und Plugins, werden von externen Entwicklern bereitgestellt und nur zu Informations- und technischen Zugriffszwecken verfügbar gemacht. cTrader Store ist kein Broker und erbringt keine Anlageberatung, persönlichen Empfehlungen oder eine Garantie für zukünftige Performance.


Preis
231
Verkäufe
690
Kostenlose Installationen