Opis
Średnia krocząca oparta na efektywności, która dynamicznie dostosowuje prędkość wygładzania w zależności od warunków rynkowych.
Oblicza wygładzanie za pomocą Wskaźnika Efektywności (ruch kierunkowy wobec całkowitej zmienności), szybko reagując w trendach i wygładzając się podczas szumu, aby uniknąć fałszywych sygnałów.
Wizualizacja w trzech stanach kolorystycznych (Zielony trend wzrostowy, Czerwony trend spadkowy, Jasnoniebieski zakres), konfigurowalne parametry czułości (Okres, szybkie/wolne wygładzanie, próg ER), automatyczne przełączanie między trybami szybkim i wolnym oraz dynamiczne zachowanie wsparcia/oporu zapewniają adaptacyjne śledzenie trendów dla traderów potrzebujących szybkości reakcji na rynkach kierunkowych i stabilności podczas konsolidacji.
CECHY
Adaptacyjny Algorytm
- Prędkość wygładzania zmienia się w oparciu o Wskaźnik Efektywności (ER) — stosunek ruchu kierunkowego do całkowitej zmienności
- Szybko reaguje, gdy efektywność wzrasta
- Wygładza się, gdy cena jest niestabilna, aby uniknąć fałszywych sygnałów
- Dynamiczna odległość od ceny w zależności od zachowania rynku
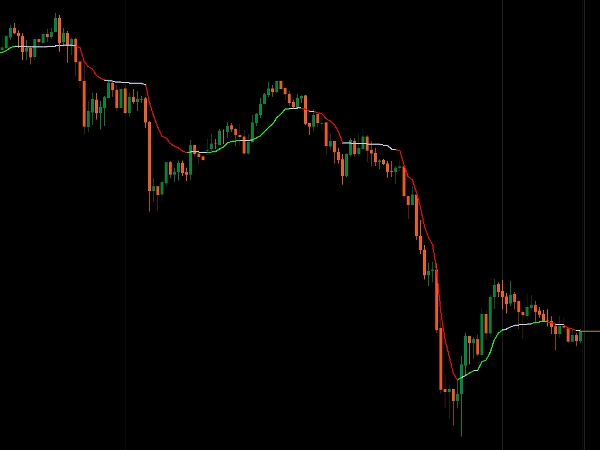
Wizualizacja w Trzech Stanach
- Zielony: Silny trend wzrostowy (ER powyżej progu + rośnie)
- Czerwony: Silny trend spadkowy (ER powyżej progu + spada)
- Jasnoniebieski: Zakres/niestabilny (ER poniżej progu)
- Natychmiastowe wizualne potwierdzenie warunków rynkowych
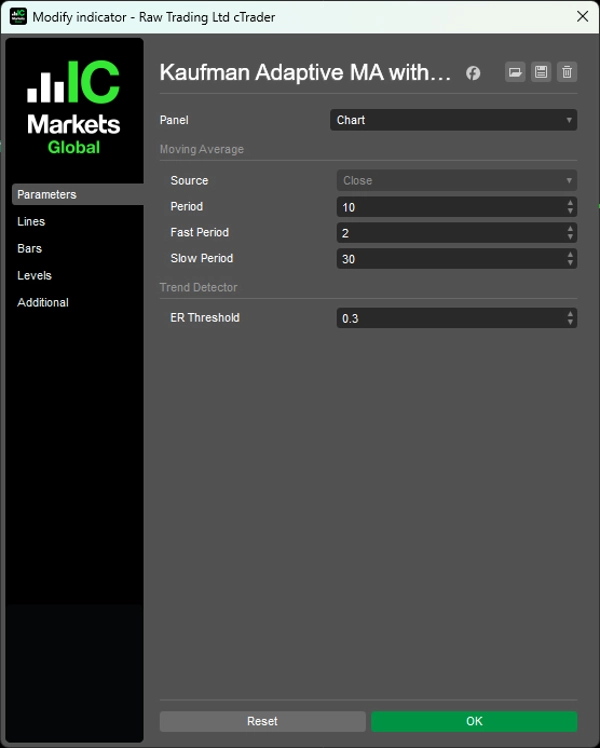
Konfigurowalna Czułość
- Okres: Okres wstecz do obliczenia efektywności (domyślnie: 10)
- Szybki Okres: Wygładzanie w silnych trendach (domyślnie: 2)
- Wolny Okres: Wygładzanie na rynkach w zakresie (domyślnie: 30)
- Próg ER: Minimalna efektywność kwalifikująca do trendu (domyślnie: 0,3)
Inteligentna Adaptacja
- Automatycznie przełącza się między szybkim a wolnym wygładzaniem
- Filtruje szumy na niestabilnych rynkach
- Wykrywa trendy wcześnie, gdy warunki się zmieniają
- Działa jako dynamiczne wsparcie/opór
__________________________________________________________________________________________
WIĘCEJ DARMOWYCH WSKAŹNIKÓW
Odkryj szeroki zakres narzędzi analizy rynku — od struktury i wolumenu po regresję, zmienność i niestandardowe ramy czasowe.
Kod źródłowy jest dostępny w repozytorium GitHub repository.
Wszystko dostępne za darmo. Jeśli jednak chcesz wesprzeć kawą, możesz to zrobić tutaj.
Wsparcie/Opór
Wolumen
- Profiler Aktywności Wolumenu
- Analizator Efektywności Wolumenu
- Analizy Profilu Wolumenu
- Profil Wolumenu - Aktualizacja
- Analiza Rozkładu Wolumenu
- VWAP (Ważona Średnia Cena Wolumenu)
Średnie Kroczące
- Kanał SSL
- Zakotwiczona Średnia Krocząca
- Średnia Krocząca Skalowana Odchyleniem
- Aktywator Ganna High Low
- Natychmiastowa Linia Trendu
- Adaptacyjna Średnia Krocząca Kaufmana z Trend Vision
- Kanał Średniej Kroczącej
- Zestaw Średnich Kroczących
- Średnia Krocząca Kanału Trendu
Narzędzia/Niestandardowe
Oparte na Regresji
Zmienność
Oscylatory
__________________________________________________________________________________________
ZASTRZEŻENIE
Handel wiąże się z ryzykiem. Ten wskaźnik jest przeznaczony wyłącznie do analizy technicznej — zawsze stosuj odpowiednie zarządzanie ryzykiem i handluj odpowiedzialnie.
OPINIE I ULEPSZENIA
Jeśli masz sugestie, prośby o funkcje lub pomysły na ulepszenia, zostaw komentarz na karcie Dyskusja. Twoja opinia pomaga ulepszyć wskaźnik dla wszystkich.
Podsumowanie
Key features include a three-state color-coded visualization: green for strong uptrends, red for strong downtrends, and light blue for ranging or choppy markets, providing immediate visual insight into market states. Users can configure sensitivity parameters such as lookback period, fast and slow smoothing periods, and the ER threshold to tailor responsiveness.
The indicator automatically switches between fast and slow smoothing modes, adapting to changing market behavior. It also acts as a dynamic support and resistance tool, helping traders identify trend shifts early while filtering out noise in consolidation phases. This adaptive approach supports scalping and other trading strategies requiring both responsiveness and stability in directional and ranging markets.


![Logo „[CB] Pivot Points Pro”](https://cdn.ctrader.com/image/webp/43463c82-67b0-4f10-a4ba-901bba091d81_32594)