Penerangan
Panduan Komprehensif untuk Analisis Awan Ichimoku
Sejarah dan Latar Belakang
Ichimoku Kinko Hyo (atau Awan Ichimoku) dibangunkan oleh wartawan Jepun Goichi Hosoda pada akhir tahun 1930-an. Selepas bertahun-tahun penyelidikan dan ujian semula bersama pasukan pembantu, Hosoda mengeluarkan penemuannya pada tahun 1969. Nama "Ichimoku Kinko Hyo" diterjemahkan sebagai "graf keseimbangan sepintas lalu," yang mencerminkan tujuan utamanya: membolehkan pedagang menilai pelbagai aspek tindakan pasaran dengan cepat dalam satu pandangan.
Inovasi Hosoda sangat luar biasa kerana beliau mencipta sistem kompleks ini beberapa dekad sebelum analisis komputer tersedia, melakukan semua pengiraan secara manual. Apa yang menjadikan sistem Ichimoku unik adalah pendekatan holistiknya, mengintegrasikan pelbagai jangka masa dan dimensi analisis pasaran ke dalam satu rangka kerja yang bersatu.
Lima Komponen Awan Ichimoku
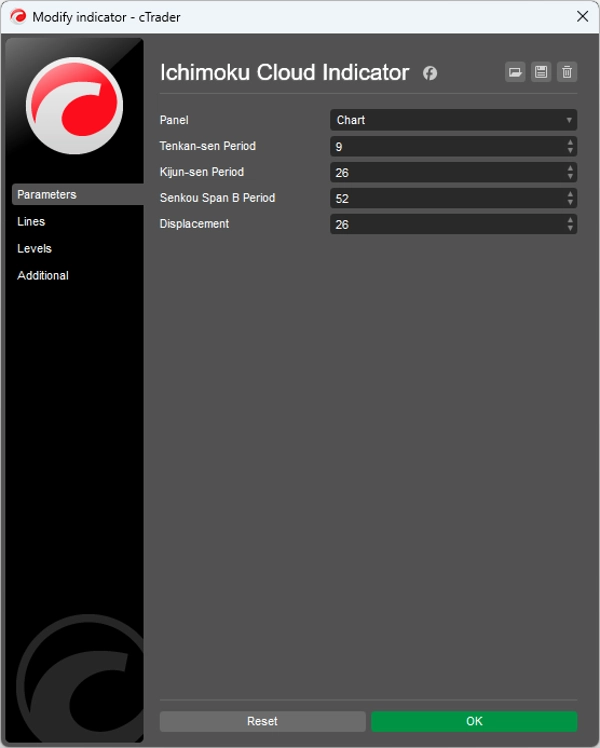
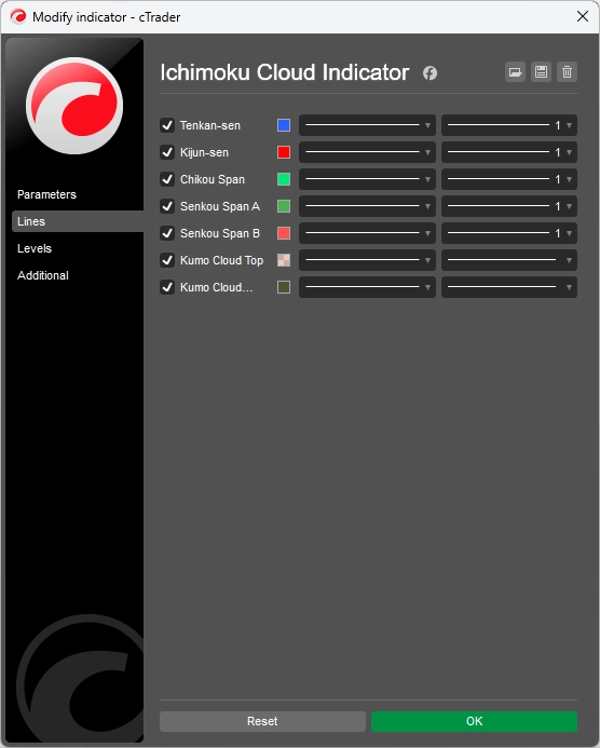
Awan Ichimoku terdiri daripada lima garis berbeza, masing-masing memberikan pandangan khusus:
1. Tenkan-sen (Garis Penukaran)
- Pengiraan: (Tinggi tertinggi + Rendah terendah) / 2 untuk 9 tempoh terakhir
- Fungsi: Mewakili momentum pasaran jangka pendek
- Tafsiran: Bertindak sebagai tahap sokongan/rintangan dinamik dan penunjuk trend
2. Kijun-sen (Garis Asas)
- Pengiraan: (Tinggi tertinggi + Rendah terendah) / 2 untuk 26 tempoh terakhir
- Fungsi: Mewakili momentum pasaran jangka sederhana
- Tafsiran: Bertindak sebagai tahap sokongan/rintangan yang lebih kuat dan boleh berfungsi sebagai hentian susulan
3. Senkou Span A (Leading Span A)
- Pengiraan: (Tenkan-sen + Kijun-sen) / 2, diplot 26 tempoh ke hadapan
- Fungsi: Membentuk tepi hadapan awan (Kumo)
- Tafsiran: Tahap sokongan/rintangan yang dijangka
4. Senkou Span B (Leading Span B)
- Pengiraan: (Tinggi tertinggi + Rendah terendah) / 2 untuk 52 tempoh terakhir, diplot 26 tempoh ke hadapan
- Fungsi: Membentuk tepi belakang awan (Kumo)
- Tafsiran: Tahap sokongan/rintangan yang dijangka
5. Chikou Span (Lagging Span)
- Pengiraan: Harga penutupan semasa, diplot 26 tempoh ke belakang
- Fungsi: Mengesahkan trend dan mengenal pasti kemungkinan pembalikan
- Tafsiran: Apabila di atas tindakan harga, bullish; apabila di bawah, bearish
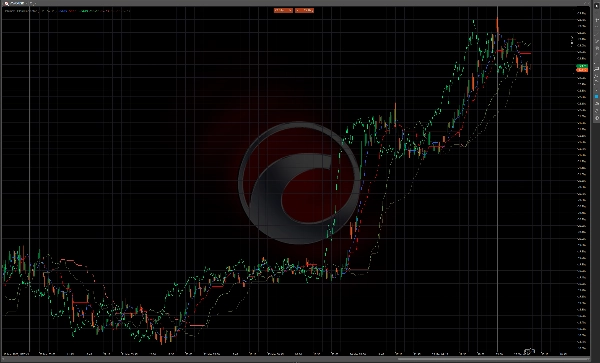
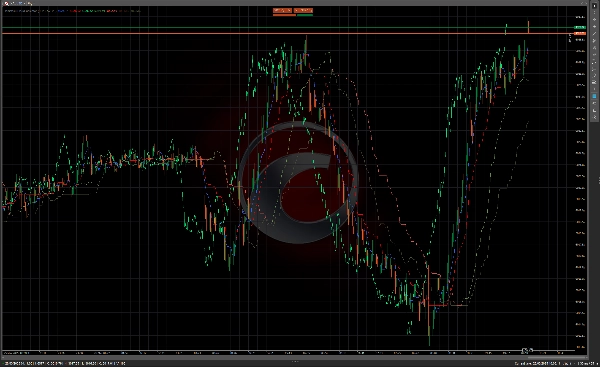
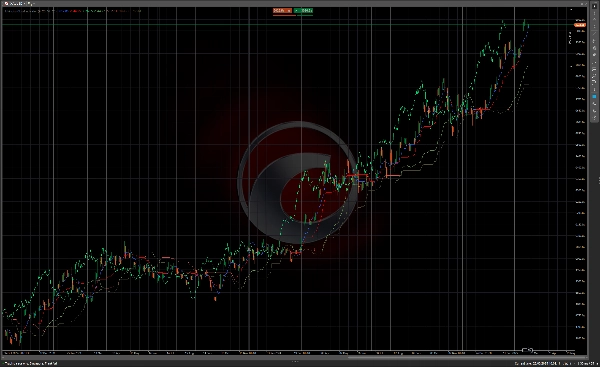
Kumo (Awan)
Kawasan antara Senkou Span A dan Senkou Span B dipanggil "Kumo" atau awan. Awan ini mewakili zon sokongan dan rintangan yang berpotensi dan ketebalannya menunjukkan volatiliti pasaran serta kekuatan zon-zon ini.
- Awan Tebal: Sokongan/rintangan yang kuat, volatiliti lebih tinggi
- Awan Nipis: Sokongan/rintangan yang lemah, volatiliti lebih rendah
- Awan Bullish: Senkou Span A di atas Senkou Span B (selalunya berwarna hijau)
- Awan Bearish: Senkou Span B di atas Senkou Span A (selalunya berwarna merah)
Peraturan dan Isyarat Perdagangan
Penentuan Trend
- Kriteria Trend Bullish:
-
- Harga berada di atas awan
- Tenkan-sen berada di atas Kijun-sen
- Chikou Span berada di atas harga dari 26 tempoh lalu
- Senkou Span A menaik dan di atas Senkou Span B (awan bullish)
- Kriteria Trend Bearish:
-
- Harga berada di bawah awan
- Tenkan-sen berada di bawah Kijun-sen
- Chikou Span berada di bawah harga dari 26 tempoh lalu
- Senkou Span A menurun dan di bawah Senkou Span B (awan bearish)
- Pasaran Neutral/Berjangka:
-
- Harga berada dalam awan
- Tenkan-sen dan Kijun-sen rata atau kerap bersilang
Isyarat Masuk
Isyarat Masuk Bullish
- TK Cross (Persilangan Tenkan/Kijun):
-
- Tenkan-sen melintasi di atas Kijun-sen
- Paling berkesan apabila harga berada di atas awan
- Isyarat lebih kuat apabila awan adalah bullish
- Pecahan Kumo:
-
- Harga memecah di atas awan selepas berada di bawah atau di dalamnya
- Isyarat lebih kuat apabila awan di hadapan adalah bullish (Senkou Span A > Senkou Span B)
- Pengesahan Chikou Span:
-
- Chikou Span melintasi di atas harga dari 26 tempoh lalu
- Tiada rintangan di hadapan untuk Chikou Span
Isyarat Masuk Bearish
- TK Cross (Bearish):
-
- Tenkan-sen melintasi di bawah Kijun-sen
- Paling berkesan apabila harga berada di bawah awan
- Isyarat lebih kuat apabila awan adalah bearish
- Pecahan Kumo (Bearish):
-
- Harga memecah di bawah awan selepas berada di atas atau di dalamnya
- Isyarat lebih kuat apabila awan di hadapan adalah bearish (Senkou Span B > Senkou Span A)
- Pengesahan Chikou Span (Bearish):
-
- Chikou Span melintasi di bawah harga dari 26 tempoh lalu
- Tiada sokongan di hadapan untuk Chikou Span
Isyarat Keluar
- Pembalikan Trend: Apabila kriteria untuk trend bertentangan mula muncul
- TK Cross: Apabila Tenkan-sen melintasi Kijun-sen ke arah bertentangan
- Sentuhan Awan: Apabila harga menyentuh sisi bertentangan awan
- Amaran Chikou Span: Apabila Chikou Span menghampiri tahap harga sejarah
Tahap Sokongan dan Rintangan
- Sokongan/Rintangan Segera: Tenkan-sen dan Kijun-sen
- Sokongan/Rintangan Jangka Sederhana: Awan (lebih kuat pada bahagian rata)
- Kumo Twist: Apabila Senkou Span A dan B bersilang, mencipta titik pembalikan berpotensi
Teknik Ichimoku Lanjutan
1. Kumo Twist (Pusingan Awan)
Kumo Twist berlaku apabila Senkou Span A dan B bersilang, mencipta titik pembalikan berpotensi 26 tempoh ke hadapan. Pedagang sering menggunakan ini sebagai isyarat amaran awal untuk perubahan trend berpotensi.
2. Analisis Jangka Masa
Ramai pedagang Ichimoku menganalisis pelbagai jangka masa:
- Jangka masa lebih tinggi untuk arah trend keseluruhan
- Jangka masa sederhana untuk isyarat masuk
- Jangka masa lebih rendah untuk masa masuk yang tepat
3. Pelebaran/Pengecilan Senkou Span
- Awan Melebar: Meningkatkan volatiliti pasaran, trend lebih kuat
- Awan Mengecil: Volatiliti menurun, kemungkinan trend melemah
4. Kumo Rata (Awan Rata)
Apabila kedua-dua Senkou Span berjalan selari, ia sering menunjukkan trend yang kuat dengan tahap sokongan/rintangan yang jelas.
Aplikasi Praktikal
Keadaan Pasaran Ideal
Awan Ichimoku berfungsi terbaik dalam pasaran yang sedang tren dan merangkumi semua jangka masa. Ia boleh digunakan pada:
- Forex
- Saham
- Komoditi
- Kriptowang
- Indeks
Pengurusan Risiko
- Gunakan awan sebagai tahap hentian rugi dinamik
- Laraskan saiz posisi berdasarkan ketebalan awan (awan lebih tebal = volatiliti lebih tinggi)
- Pertimbangkan Kijun-sen sebagai hentian susulan dalam trend yang kuat
Keserasian Jangka Masa
Tetapan tradisional (9, 26, 52) berdasarkan minggu perdagangan Jepun (yang mempunyai 6 hari), jadi sesetengah pedagang menyesuaikan tetapan ini:
- 10, 30, 60 untuk carta harian
- 20, 60, 120 untuk isyarat yang lebih konservatif
- 7, 22, 44 untuk pasaran Barat (minggu perdagangan 5 hari)
Kesimpulan
Awan Ichimoku menawarkan sistem perdagangan yang komprehensif yang menyediakan pelbagai lapisan maklumat pasaran dalam satu pandangan. Apa yang menjadikannya berkuasa bukan hanya isyarat individu tetapi gabungan pelbagai penunjuk yang bekerja bersama. Apabila semua komponen selari, sistem Ichimoku boleh menyediakan peluang perdagangan berkemungkinan tinggi dengan parameter risiko yang jelas.
Walaupun pada mulanya kelihatan kompleks, dengan latihan, pedagang memang boleh menilai keadaan pasaran "sekilas pandang" seperti yang dimaksudkan oleh Hosoda. Komponen pemindahan masa sistem ini juga memberikan perspektif unik tentang dinamik pasaran, membolehkan pedagang melihat tahap sokongan dan rintangan masa depan yang berpotensi sebelum ia menjadi relevan.
Ringkasan
1. Tenkan-sen (Conversion Line): short-term momentum indicator and dynamic support/resistance.
2. Kijun-sen (Base Line): medium-term momentum indicator and stronger support/resistance, also used as a trailing stop.
3. Senkou Span A (Leading Span A): forms the leading edge of the cloud (Kumo), projected 26 periods ahead.
4. Senkou Span B (Leading Span B): forms the trailing edge of the cloud, projected 26 periods ahead.
5. Chikou Span (Lagging Span): current closing price plotted 26 periods back, confirming trends and potential reversals.
The cloud (Kumo), formed between Senkou Span A and B, represents support and resistance zones, with thickness indicating volatility and strength. The indicator provides trend determination, entry and exit signals, and support/resistance levels. It is applicable across various markets including Forex, stocks, commodities, cryptocurrencies, and indices, and works best in trending markets and multiple time frames. Risk management features include dynamic stop-loss levels based on the cloud and position sizing adjustments according to cloud thickness. Traditional settings are (9, 26, 52) periods, with common adjustments for different trading weeks.