
Opis
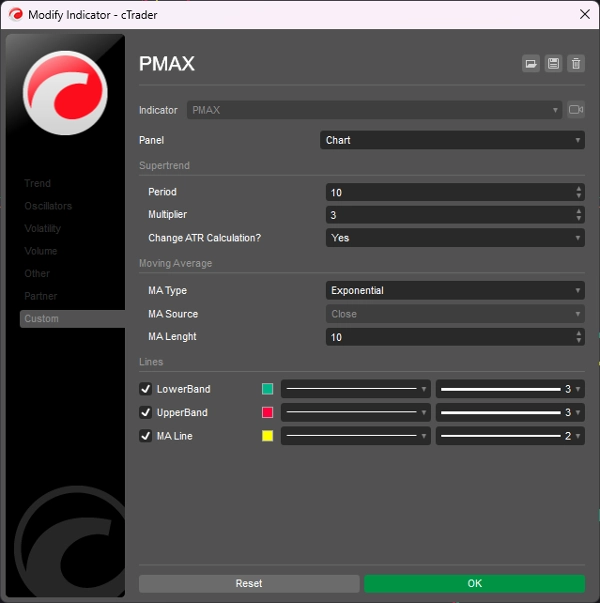
PMax (Profit Maximizer) to zupełnie nowy wskaźnik opracowany przez KivancOzbilgic na początku 2020 roku.
Jest to połączenie dwóch wskaźników trailing stop loss;
Jeden to wskaźnik MOST (Moving Stop Loss) Anıla Özekşi, a drugi to dobrze znany SuperTrend oparty na ATR.
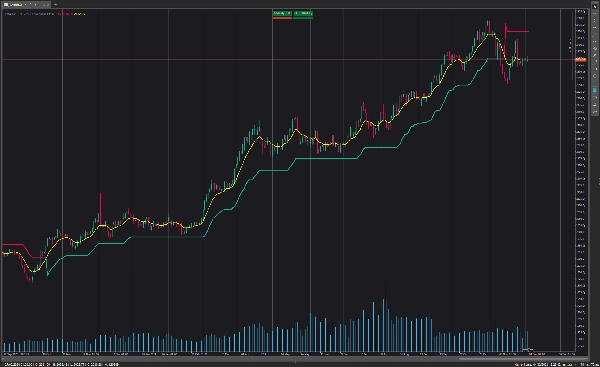
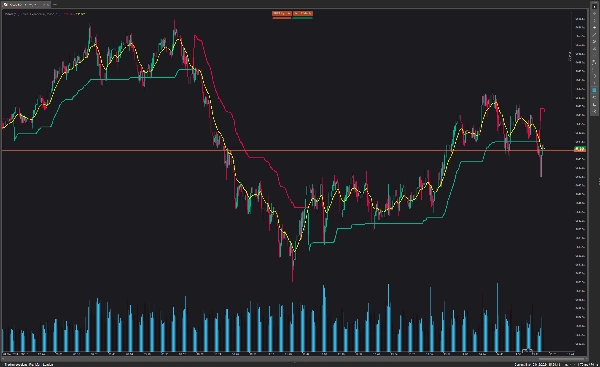
Zarówno wskaźniki MOST, jak i SuperTrend są bardzo dobre w systemach podążania za trendem, ale odwrotnie ich wydajność nie jest zadowalająca w warunkach rynku bocznego, podobnie jak większości innych wskaźników.
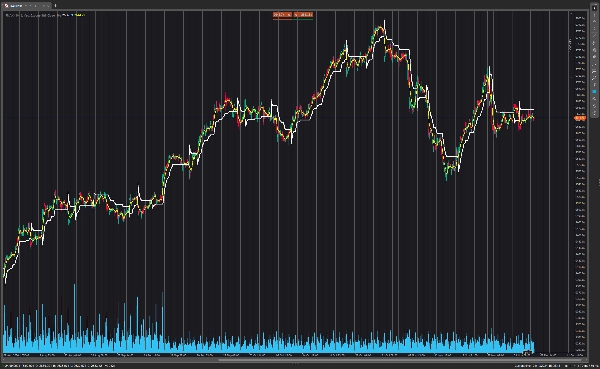
Profit Maximizer - PMax stara się rozwiązać ten problem. PMax łączy silne strony MOST (Moving Average Trend Changer) i SuperTrend (detekcja ceny ATR) w jednym wskaźniku.
Wyniki testów historycznych i optymalizacji PMax są znacznie lepsze w porównaniu do jego poprzedników MOST i SuperTrend. Redukuje liczbę fałszywych sygnałów na rynku bocznym i daje bardziej wiarygodne sygnały handlowe.
PMax ułatwia określenie trendu i może być używany na każdym rodzaju rynków i instrumentów. Nie przerysowuje.
Podsumowanie
This combination enhances trend identification and reduces false signals during non-trending market phases. Backtesting and optimization show that PMax outperforms its component indicators in reliability and signal accuracy. It is designed for use across various markets and instruments and does not repaint, providing consistent signals for traders.
Opinie klientów
5 | 100 % | |
4 | 0 % | |
3 | 0 % | |
2 | 0 % | |
1 | 0 % |


