
Laguerre RSI
Indikator
649 muat turun
Versi 1.0, Oct 2024
Windows, Mac
5.0
Ulasan: 1
Penerangan
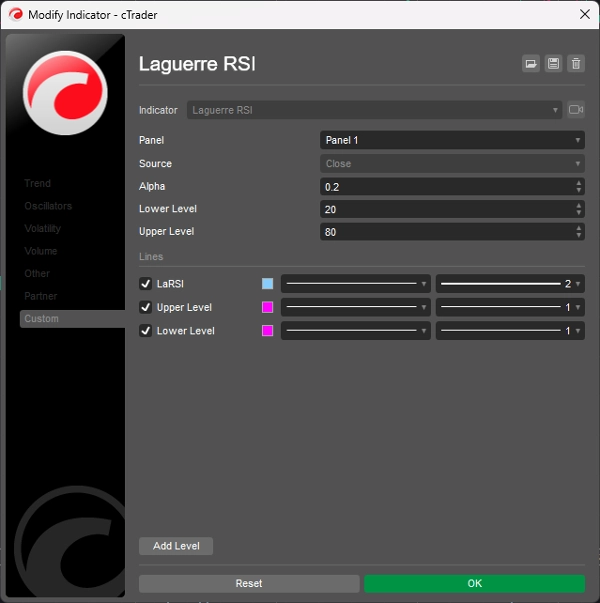
Laguerre RSI berdasarkan Penapis Laguerre John EHLERS untuk mengelakkan bunyi RSI.
Tukar pekali alpha untuk meningkatkan/mengurangkan kelewatan dan kelicinan.
the
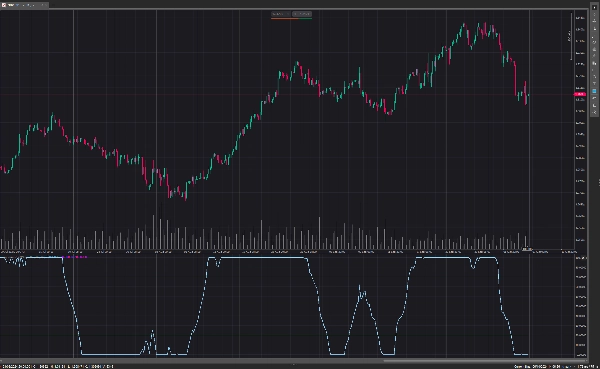
Beli apabila Laguerre RSI melintasi ke atas melebihi 20.
Jual apabila Laguerre RSI melintasi ke bawah di bawah 80.
Semasa penunjuk berjalan rata di atas 80, aliran menaik adalah kuat.
Semasa penunjuk berjalan rata di bawah paras 20, ia bermakna aliran menurun adalah kuat.
Ringkasan
Ringkasan AI
Laguerre RSI is a technical indicator based on John Ehlers' Laguerre Filter designed to reduce the noise commonly found in traditional Relative Strength Index (RSI) calculations. It allows users to adjust the alpha coefficient to control the lag and smoothness of the indicator, tailoring its responsiveness to market conditions. The indicator generates buy signals when the Laguerre RSI crosses upward above the 20 level and sell signals when it crosses downward below the 80 level. Additionally, a flat reading above 80 indicates a strong uptrend, while a flat reading below 20 signals a strong downtrend. This indicator is used to identify trend strength and potential entry and exit points by filtering out market noise inherent in standard RSI measurements.
Profil indikator
Ulasan pelanggan
5.0
Ulasan: 1
5 | 100 % | |
4 | 0 % | |
3 | 0 % | |
2 | 0 % | |
1 | 0 % |
Ulasan pelanggan
July 14, 2025
Pros: Smooths RSI using Laguerre filter, reducing noise and lag. Clear overbought/oversold levels. Great for scalping. Cons: No alerts or tooltips. Requires confirmation with trend filters. Lacks setting templates and advanced features.
Perbincangan
Soalan Lazim
RSI
Produk yang tersedia melalui cTrader Store, termasuk bot dagangan, indikator dan plugin, disediakan oleh pembangun pihak ketiga dan diberikan akses untuk tujuan maklumat dan teknikal sahaja. cTrader Store bukan broker dan tidak memberikan nasihat pelaburan, syor peribadi atau sebarang jaminan prestasi masa hadapan.
Lebih banyak produk daripada penulis ini


Harga
2
Jualan
6.91K
Pemasangan percuma