
Penerangan
Panduan Pengguna WinSMC
1. Tujuan
`WinSMC` adalah penunjuk SMC overlay untuk cTrader. Ia membantu anda mengenal pasti secara visual:
- Perubahan struktur pasaran
- `BOS` (Pecahan Struktur)
- `MSS` (Peralihan Struktur Pasaran)
- `Blok Pesanan`
- `Liquidity Grabs` / `Sweeps`
- `FVG` (Jurang Nilai Adil)
Ia bukan sistem perdagangan automatik. Ia adalah alat struktur dan konteks yang terbaik digunakan untuk perdagangan berasaskan pengesahan.
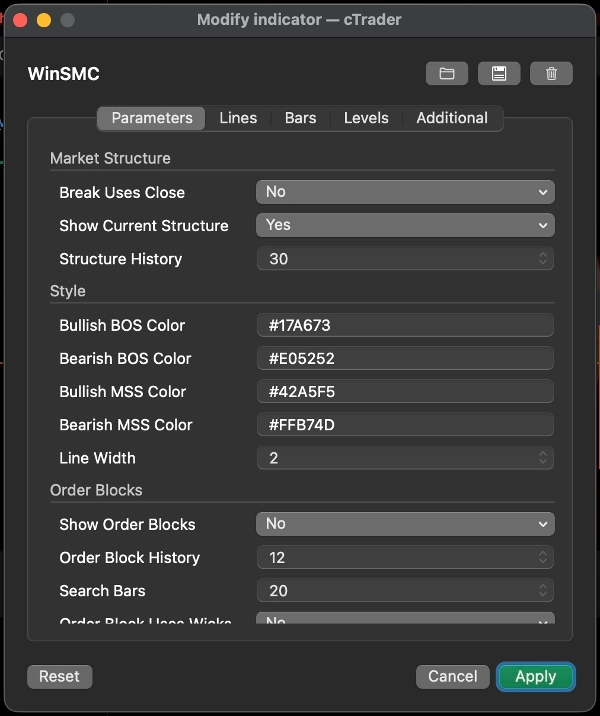
2. Konsep Teras
Panjang Ayunan
`Panjang Ayunan` mengawal sejauh mana kiri dan kanan pivot mesti disahkan sebelum ia dianggap sebagai titik ayunan yang sah.
Panduan praktikal:
- Nilai lebih kecil = lebih banyak isyarat, lebih banyak bunyi
- Nilai lebih besar = kurang isyarat, struktur lebih bersih
Pecahan Menggunakan Penutupan
Tetapan ini menentukan sama ada pecahan struktur disahkan oleh:
- `Ya`: penutupan lilin
- `Tidak`: pecahan sumbu/rendah/tinggi
Panduan:
- Gunakan penutupan untuk pendekatan yang lebih konservatif
- Gunakan pecahan sumbu untuk pengesanan lebih awal dan lebih sensitif
Tunjukkan Struktur Semasa
Menunjukkan garis ayunan tinggi dan ayunan rendah aktif semasa, membantu anda melihat apa yang masih dihormati oleh pasaran.
Sejarah Struktur
Mengawal berapa banyak garis pecahan struktur dan label yang disimpan pada carta.
3. BOS dan MSS
BOS
`BOS` bermaksud harga terus dalam arah yang sama dan memecahkan tinggi atau rendah sebelumnya.
Tafsiran tipikal:
- Dalam tren menaik, memecahkan tinggi sebelumnya adalah BOS bullish
- Dalam tren menurun, memecahkan rendah sebelumnya adalah BOS bearish
MSS
`MSS` bermaksud pasaran telah berubah arah dari bias sebelumnya.
Tafsiran tipikal:
- Jika harga bearish dan memecahkan tinggi sebelumnya, itu adalah MSS bullish
- Jika harga bullish dan memecahkan rendah sebelumnya, itu adalah MSS bearish
Penggunaan perdagangan
- `BOS` lebih berorientasikan kesinambungan tren
- `MSS` lebih berorientasikan pembalikan
- Masuk terbaik biasanya datang dari retest `Blok Pesanan` atau `FVG`
4. Blok Pesanan
`Blok Pesanan` adalah lilin bertentangan terakhir sebelum pecahan struktur. Ia biasanya dianggap sebagai zon reaksi bekalan/permintaan.
Tunjukkan Blok Pesanan
Apabila diaktifkan, penunjuk melihat ke belakang selepas `BOS` atau `MSS` dan melukis zon lilin bertentangan terakhir.
Maksud
- OB Bullish: selepas pecahan bullish, lilin bearish terakhir digunakan
- OB Bearish: selepas pecahan bearish, lilin bullish terakhir digunakan
Apabila harga mula berinteraksi dengan zon tersebut, ia ditandakan sebagai telah diatasi.
Blok Pesanan Menggunakan Sumbu
Ini mengawal sejauh mana kotak dilukis:
- `Ya`: gunakan julat lilin penuh, zon lebih lebar
- `Tidak`: gunakan zon teras yang lebih ketat
Panduan:
- Gunakan `Ya` untuk zon yang lebih luas dan konservatif
- Gunakan `Tidak` untuk zon yang lebih sempit dan tepat
Strategi Blok Pesanan
Aliran kerja biasa:
1. Tunggu `BOS` atau `MSS`
2. Tandakan OB yang sepadan
3. Tunggu retest
4. Cari pengesahan sebelum masuk
Jangan anggap OB sebagai titik pembalikan yang dijamin. Ia adalah kawasan minat tinggi, bukan kepastian.
5. Liquidity Grabs / Sweeps
`Liquidity Grab` bermaksud harga melampaui tinggi sebelumnya atau rendah sebelumnya, kemudian menutup kembali di dalamnya.
Dalam penunjuk ini:
- `Buy-side sweep`: harga mengambil tinggi sebelumnya dan menutup kembali di bawahnya
- `Sell-side sweep`: harga mengambil rendah sebelumnya dan menutup kembali di atasnya
Ini biasanya bermaksud pasaran telah mengambil kecairan dan mungkin bersiap untuk pergerakan seterusnya.
Penting
Sweep sahaja bukan isyarat perdagangan.
Ia lebih baik dianggap sebagai:
- Amaran bahawa kecairan telah diambil
- Petunjuk persediaan
- Sebab untuk menunggu `MSS` atau `BOS`
Penggunaan biasa
- Selepas `Buy-side sweep`, `MSS` bearish boleh menyokong persediaan jualan
- Selepas `Sell-side sweep`, `MSS` bullish boleh menyokong persediaan pembelian
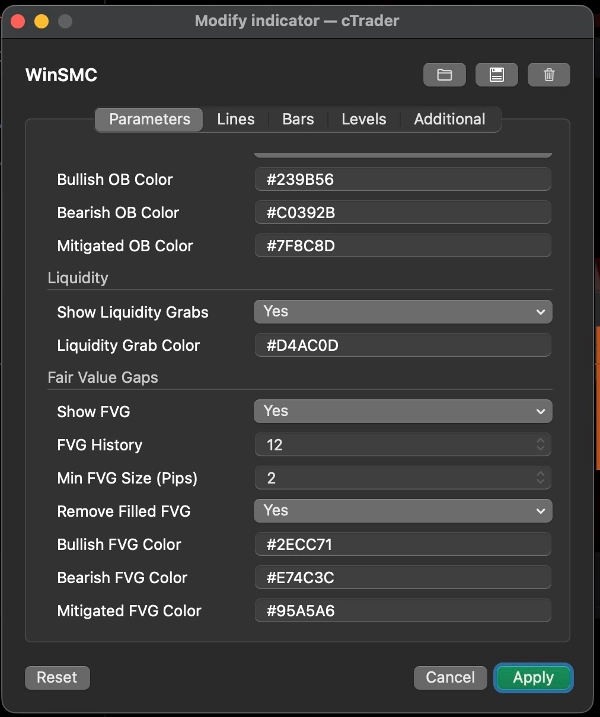
6. FVG
`FVG` adalah Jurang Nilai Adil yang dicipta oleh ketidakseimbangan tiga lilin.
Tunjukkan FVG
Apabila diaktifkan, penunjuk melukis zon FVG yang kelihatan.
Peraturan pengesanan
- FVG Bullish: tinggi lilin pertama di bawah rendah lilin ketiga
- FVG Bearish: rendah lilin pertama di atas tinggi lilin ketiga
Saiz Min FVG (Pips)
Ini menapis jurang kecil.
- Unit: `pips`
- Nilai lebih tinggi = kurang tetapi FVG lebih bermakna
- `0` = tiada penapis saiz
Berguna apabila carta sesak atau apabila jurang kecil 1-piksel tidak berguna untuk aliran kerja anda.
Alih Keluar FVG Terisi
Apabila diaktifkan, FVG yang sepenuhnya terisi akan dialih keluar dari carta.
Strategi FVG
Dua pendekatan biasa:
1. Retrace tren
- Tunggu `BOS` atau `MSS`
- Tunggu harga retrace ke dalam FVG
- Berdagang mengikut arah struktur
2. Masuk berasaskan pengesahan
- Perhatikan sweep
- Tunggu `MSS`
- Gunakan FVG sebagai zon retracement akhir
7. Gaya Perdagangan yang Disyorkan
Strategi A: Kesinambungan Tren
Terbaik apabila pasaran jelas dalam tren.
Aliran kerja:
1. Tunggu `BOS`
2. Tandakan OB
3. Cari retrace ke OB atau FVG
4. Masuk hanya selepas harga bertindak balas
Ini adalah pendekatan mengikuti tren klasik.
Strategi B: Sweep Kemudian Pembalikan
Terbaik apabila pasaran tidak stabil dan cenderung kepada pecahan palsu.
Aliran kerja:
1. Kenal pasti `Buy-side sweep` atau `Sell-side sweep`
2. Tunggu `MSS` bertentangan
3. Gunakan OB atau FVG sebagai zon retracement
4. Masuk selepas pengesahan
Ini lebih kuat daripada berdagang hanya berdasarkan sweep.
Strategi C: Sweep + MSS + Konfluens OB/FVG
Ini adalah salah satu cara paling bersih untuk menggunakan penunjuk ini.
Aliran kerja:
1. Dapatkan sweep
2. Dapatkan MSS
3. Tunggu retest OB atau FVG
4. Berdagang hanya apabila zon bertindih
Ini mengurangkan kemasukan awal yang tidak sesuai.
8. Cadangan Tetapan Pantas
- `Panjang Ayunan`: mulakan dengan 5 atau 7
- `Pecahan Menggunakan Penutupan`: hidupkan untuk pandangan yang lebih konservatif
- `Blok Pesanan Menggunakan Sumbu`: hidupkan untuk zon yang lebih lebar
- `Saiz Min FVG (Pips)`: mulakan dengan 2.0 dan laraskan mengikut instrumen
- `Sejarah Struktur` / `Sejarah Blok Pesanan` / `Sejarah FVG`: laraskan untuk memastikan carta boleh dibaca
9. Nota Akhir
`WinSMC` paling baik digunakan sebagai peta struktur, bukan sebagai pencetus isyarat tunggal.
Aliran kerja yang paling boleh dipercayai adalah:
- Kenal pasti arah tren
- Perhatikan sweep kecairan
- Tunggu MSS atau BOS
- Gunakan OB atau FVG sebagai zon masuk
- Masuk hanya selepas pengesahan
Ringkasan
The indicator helps traders analyze price action by marking swing highs and lows, confirming valid swing points based on customizable swing length, and distinguishing breaks using candle closes or wick extremes. Order Blocks are displayed as supply/demand zones derived from the last opposite candle before a structure break, with options to adjust zone width. Liquidity Sweeps indicate price movements beyond prior highs or lows that close back inside, signaling potential setups rather than direct trade signals. FVG zones are identified by three-candle imbalances and can be filtered by minimum size and removed once filled.
WinSMC supports multiple trading strategies, including trend continuation after BOS, reversal setups following liquidity sweeps and MSS, and confluence-based entries combining sweeps, MSS, and retests of Order Blocks or FVGs. It is intended as a confirmation and structure mapping tool rather than an automated trading system, aiding traders in timing entries with contextual market information.

![Logo "[CB] Pivot Points Pro"](https://cdn.ctrader.com/image/webp/43463c82-67b0-4f10-a4ba-901bba091d81_32594)


