Penerangan
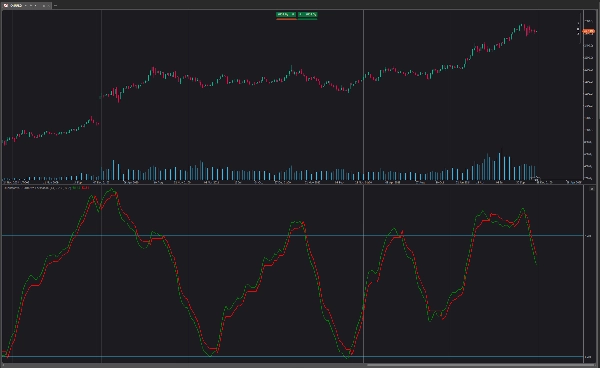
QQE (Quantitative Qualitative Estimation) Weighted Oscillator memperbaiki versi asalnya dengan memberi berat pada RSI berdasarkan petunjuk yang diberikan oleh trailing stop, memerlukan lebih banyak usaha agar berlaku persilangan dengan trailing stop. QQE Weighted Oscillator terdiri daripada osilator RSI yang dilicinkan dan trailing stop yang diperoleh daripada RSI yang sama.
Osilator ini boleh digunakan untuk menunjukkan sama ada pasaran terlebih beli/terlebih jual serta sebagai petunjuk awal pembalikan tren terima kasih kepada sifat utama RSI.
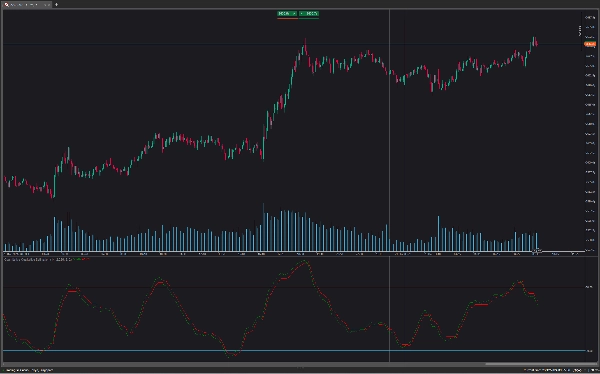
Menggunakan nilai Factor yang lebih tinggi akan menghasilkan trailing stop jangka panjang.
Seperti dengan RSI biasa, divergennya boleh menjadi petunjuk pembalikan.
Pemberatan lanjut akan mengawal berapa banyak "usaha" yang diperlukan agar trailing stop melintasi RSI. Sebagai contoh, RSI di atas trailing stop akan memerlukan tahap variasi harga negatif yang lebih tinggi agar persilangan berpotensi berlaku apabila menggunakan pemberatan yang lebih tinggi.
Ini boleh menyebabkan pemberatan yang lebih tinggi menghasilkan keputusan yang lebih kitaran dan licin.
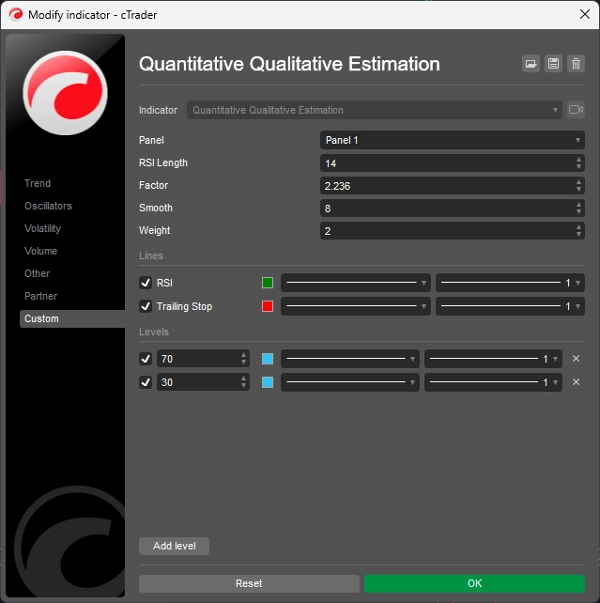
Cara mengubah tetapan:
- Length: Panjang osilator RSI.
- Factor: Faktor pendaraban yang digunakan untuk pengiraan trailing stop.
- Smooth: Tahap kelicinan osilator RSI.
- Weight: Tahap pemberatan yang digunakan untuk pengiraan RSI.
Ringkasan
Ulasan pelanggan
5 | 100 % | |
4 | 0 % | |
3 | 0 % | |
2 | 0 % | |
1 | 0 % |