
KDJ
Indicatore
255 download
Versione 1.0, Dec 2024
Windows, Mac
5.0
Recensioni: 1
Descrizione
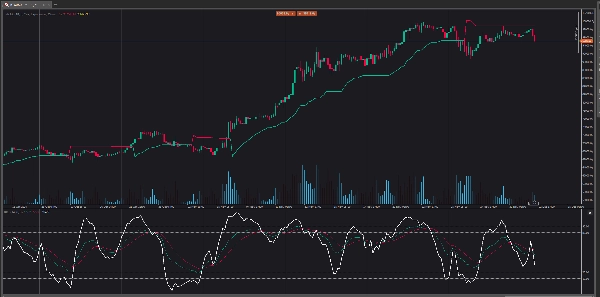
La visualizzazione dell'oscillatore KDJ consiste in 3 linee (K, D e J - da cui il nome della visualizzazione) e 2 livelli. K e D sono le stesse linee utilizzate nell'oscillatore stocastico. La linea J rappresenta la deviazione del valore D rispetto al valore K. La convergenza di queste linee indica nuove opportunità di trading. Come per l'Oscillatore Stocastico, i livelli di ipervenduto e ipercomprato corrispondono ai momenti in cui è probabile che il trend si inverta.
Riepilogo
Riepilogo AI
The KDJ indicator is an oscillator consisting of three lines: K, D, and J, along with two reference levels. The K and D lines correspond to those used in the stochastic oscillator, while the J line measures the deviation of the D value from the K value. This convergence of the three lines is used to identify potential new trading opportunities. Similar to the stochastic oscillator, the KDJ indicator highlights overbought and oversold conditions, which often signal possible trend reversals. This tool is designed to assist traders in timing entries and exits by analyzing momentum and trend strength through these oscillating lines.
Profilo indicatore
Recensioni dei clienti
5.0
Recensioni: 1
5 | 100 % | |
4 | 0 % | |
3 | 0 % | |
2 | 0 % | |
1 | 0 % |
Recensioni dei clienti
August 18, 2025
Pros: Three-line stochastic oscillator (K, D, J) that identifies overbought/oversold levels and momentum shifts. Supports divergence analysis and crossovers between K and D as trading signals. Lightweight and responsive. Cons: No alerts, tooltips, or settings presets. J‑line can generate outlier v
Discussioni
Domande frequenti
I prodotti disponibili tramite cTrader Store, inclusi bot di trading, indicatori e plugin, sono forniti da sviluppatori terzi e resi disponibili esclusivamente a scopo informativo e di accesso tecnico. cTrader Store non è un broker e non fornisce consulenze in materia di investimento, raccomandazioni individualizzate o garanzie di risultati futuri.
Altro da questo autore


Prezzo
2
Vendite
6.9K
Installazioni gratuite