
Açıklama
Ichimoku Bulut Analizine Kapsamlı Rehber
Tarihçe ve Arka Plan
Ichimoku Kinko Hyo (veya Ichimoku Bulutu), Japon gazeteci Goichi Hosoda tarafından 1930'ların sonlarında geliştirilmiştir. Yıllarca süren araştırma ve asistanlarıyla yapılan geriye dönük testlerin ardından, Hosoda bulgularını 1969'da yayımlamıştır. "Ichimoku Kinko Hyo" adı, "bir bakışta denge grafiği" anlamına gelir ve amacını yansıtır: Tüccarların piyasa hareketinin birden fazla yönünü hızlıca tek bir görünümde değerlendirmesine olanak tanımak.
Hosoda'nın yeniliği dikkat çekicidir çünkü bu karmaşık sistemi, bilgisayar analizlerinin mevcut olmadığı yıllarda, tüm hesaplamaları elle yaparak oluşturmuştur. Ichimoku sistemini benzersiz kılan, çoklu zaman dilimlerini ve piyasa analizinin çeşitli boyutlarını bütünsel bir çerçevede birleştiren yaklaşımıdır.
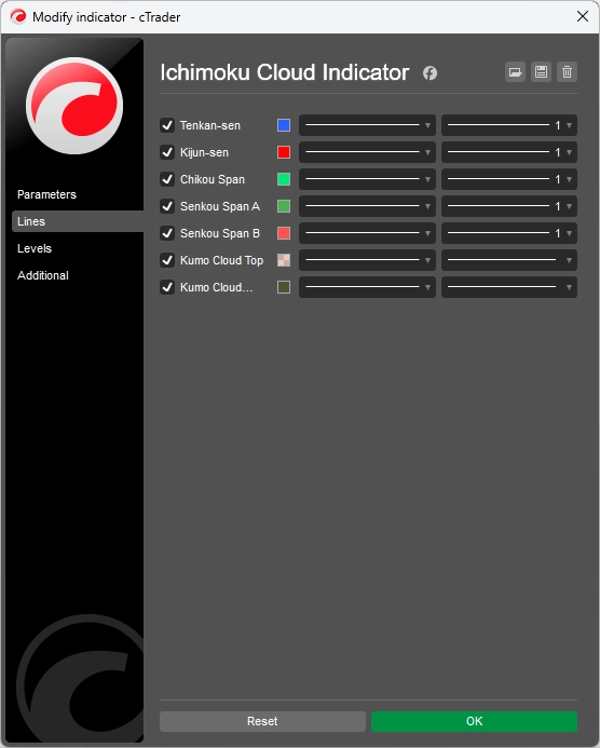
Ichimoku Bulutunun Beş Bileşeni
Ichimoku Bulutu, her biri belirli bilgiler sağlayan beş ayrı çizgiden oluşur:
1. Tenkan-sen (Dönüşüm Çizgisi)
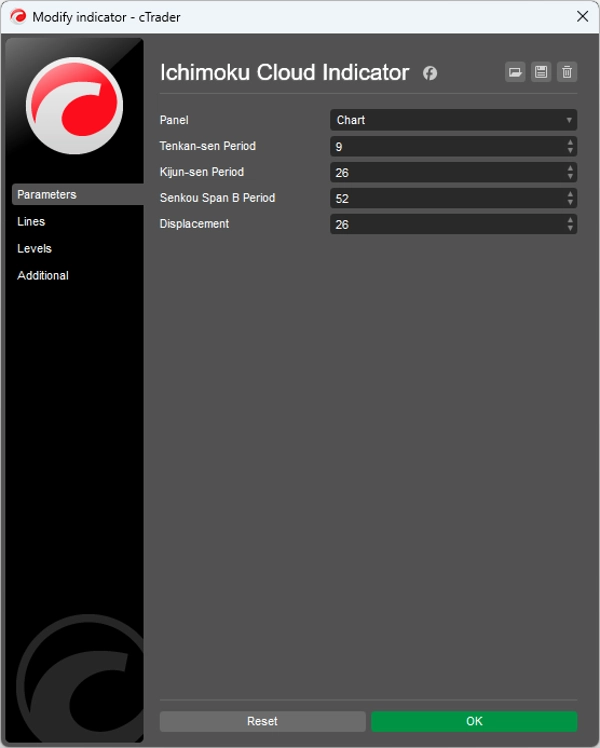
- Hesaplama: Son 9 periyot için (En yüksek + En düşük) / 2
- Fonksiyon: Kısa vadeli piyasa momentumu temsil eder
- Yorum: Dinamik destek/direnç seviyesi ve trend göstergesi olarak görev yapar
2. Kijun-sen (Temel Çizgi)
- Hesaplama: Son 26 periyot için (En yüksek + En düşük) / 2
- Fonksiyon: Orta vadeli piyasa momentumu temsil eder
- Yorum: Daha güçlü bir destek/direnç seviyesi olarak görev yapar ve takip eden stop olarak kullanılabilir
3. Senkou Span A (Öncü Span A)
- Hesaplama: (Tenkan-sen + Kijun-sen) / 2, 26 periyot ileriye çizilir
- Fonksiyon: Bulutun (Kumo) öncü kenarını oluşturur
- Yorum: Projeksiyonlu destek/direnç seviyesi
4. Senkou Span B (Öncü Span B)
- Hesaplama: Son 52 periyot için (En yüksek + En düşük) / 2, 26 periyot ileriye çizilir
- Fonksiyon: Bulutun (Kumo) arka kenarını oluşturur
- Yorum: Projeksiyonlu destek/direnç seviyesi
5. Chikou Span (Gecikmeli Span)
- Hesaplama: Mevcut kapanış fiyatı, 26 periyot geriye çizilir
- Fonksiyon: Trendleri onaylar ve potansiyel dönüşleri belirler
- Yorum: Fiyat hareketinin üzerindeyse yükseliş, altındaysa düşüş sinyali verir
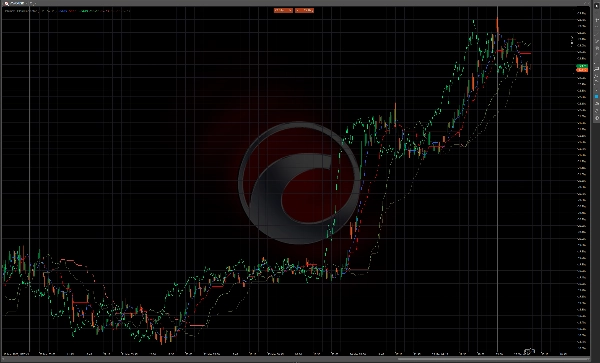
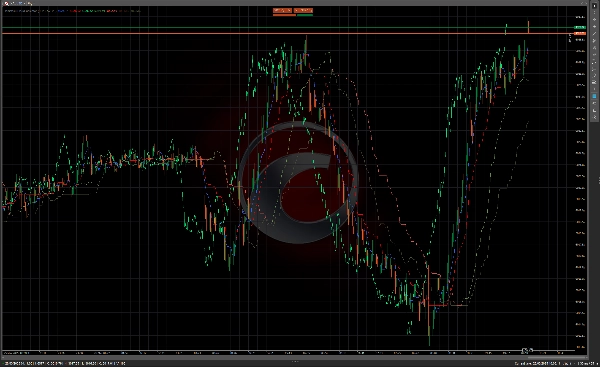
Kumo (Bulut)
Senkou Span A ile Senkou Span B arasındaki alana "Kumo" veya bulut denir. Bulut, potansiyel destek ve direnç bölgelerini temsil eder ve kalınlığı piyasa volatilitesini ve bu bölgelerin gücünü gösterir.
- Kalın Bulut: Güçlü destek/direnç, daha yüksek volatilite
- İnce Bulut: Daha zayıf destek/direnç, daha düşük volatilite
- Boğa Bulutu: Senkou Span A, Senkou Span B'nin üzerinde (genellikle yeşil renkte)
- Ayı Bulutu: Senkou Span B, Senkou Span A'nın üzerinde (genellikle kırmızı renkte)
Ticaret Kuralları ve Sinyalleri
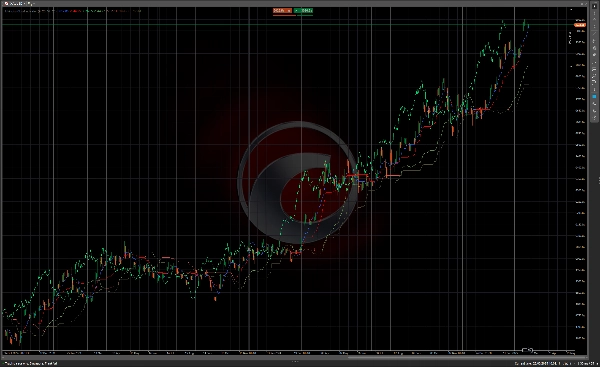
Trend Belirleme
- Boğa Trend Kriterleri:
-
- Fiyat bulutun üzerindedir
- Tenkan-sen, Kijun-sen'in üzerindedir
- Chikou Span, 26 periyot önceki fiyatın üzerindedir
- Senkou Span A yükseliyor ve Senkou Span B'nin üzerindedir (boğa bulutu)
- Ayı Trend Kriterleri:
-
- Fiyat bulutun altındadır
- Tenkan-sen, Kijun-sen'in altındadır
- Chikou Span, 26 periyot önceki fiyatın altındadır
- Senkou Span A düşüyor ve Senkou Span B'nin altındadır (ayı bulutu)
- Nötr/Aralıkta Piyasa:
-
- Fiyat bulutun içindedir
- Tenkan-sen ve Kijun-sen yatay veya sık sık kesişmektedir
Giriş Sinyalleri
Boğa Giriş Sinyalleri
- TK Kesişimi (Tenkan/Kijun Kesişimi):
-
- Tenkan-sen, Kijun-sen'in üzerine çıkar
- Fiyat bulutun üzerindeyken en etkili
- Bulut boğaysa sinyal daha güçlüdür
- Kumo Kırılması:
-
- Fiyat, bulutun altında veya içinde olduktan sonra bulutun üzerine çıkar
- İleriye dönük bulut boğaysa sinyal daha güçlüdür (Senkou Span A > Senkou Span B)
- Chikou Span Onayı:
-
- Chikou Span, 26 periyot önceki fiyatın üzerine çıkar
- Chikou Span için önünde direnç yoktur
Ayı Giriş Sinyalleri
- TK Kesişimi (Ayı):
-
- Tenkan-sen, Kijun-sen'in altına iner
- Fiyat bulutun altındayken en etkili
- Bulut ayıysa sinyal daha güçlüdür
- Kumo Kırılması (Ayı):
-
- Fiyat, bulutun üzerinde veya içinde olduktan sonra bulutun altına iner
- İleriye dönük bulut ayıysa sinyal daha güçlüdür (Senkou Span B > Senkou Span A)
- Chikou Span Onayı (Ayı):
-
- Chikou Span, 26 periyot önceki fiyatın altına iner
- Chikou Span için önünde destek yoktur
Çıkış Sinyalleri
- Trend Dönüşü: Karşı trend kriterleri ortaya çıkmaya başladığında
- TK Kesişimi: Tenkan-sen, Kijun-sen ile ters yönde kesiştiğinde
- Bulut Teması: Fiyat bulutun karşı tarafına dokunduğunda
- Chikou Span Uyarısı: Chikou Span tarihsel fiyat seviyelerine yaklaştığında
Destek ve Direnç Seviyeleri
- Anlık Destek/Direnç: Tenkan-sen ve Kijun-sen
- Orta Vadeli Destek/Direnç: Bulut (düz bölümlerde daha güçlü)
- Kumo Bükülmesi: Senkou Span A ve B kesiştiğinde, potansiyel dönüş noktaları oluşturur
Gelişmiş Ichimoku Teknikleri
1. Kumo Bükülmesi (Bulut Bükülmesi)
Kumo Bükülmesi, Senkou Span A ve B'nin kesiştiği ve gelecekte 26 periyot sonra potansiyel bir dönüş noktası oluşturduğu durumdur. Tüccarlar bunu potansiyel trend değişiklikleri için erken uyarı sinyali olarak kullanır.
2. Zaman Dilimleri Analizi
Birçok Ichimoku tüccarı birden fazla zaman dilimini analiz eder:
- Genel trend yönü için daha yüksek zaman dilimi
- Giriş sinyalleri için orta zaman dilimi
- Kesin giriş zamanlaması için daha düşük zaman dilimi
3. Senkou Span Genişlemesi/Sıkışması
- Genişleyen Bulut: Artan piyasa volatilitesi, daha güçlü trend
- Daralan Bulut: Azalan volatilite, potansiyel trend zayıflaması
4. Düz Kumo (Düz Bulut)
Her iki Senkou Span paralel seyrettiğinde, genellikle net destek/direnç seviyeleri ile güçlü bir trendi gösterir.
Pratik Uygulamalar
İdeal Piyasa Koşulları
Ichimoku Bulutu, trend olan piyasalarda ve tüm zaman dilimlerinde en iyi şekilde çalışır. Şu alanlarda uygulanabilir:
- Forex
- Hisse Senetleri
- Emtialar
- Kripto Paralar
- Endeksler
Risk Yönetimi
- Bulutu dinamik bir stop-loss seviyesi olarak kullanın
- Pozisyon büyüklüğünü bulut kalınlığına göre ayarlayın (daha kalın bulut = daha yüksek volatilite)
- Güçlü trendlerde Kijun-sen'i takip eden stop olarak düşünün
Zaman Dilimi Uyumluluğu
Geleneksel ayarlar (9, 26, 52) Japon ticaret haftasına (6 gün) dayanıyordu, bu yüzden bazı tüccarlar bu ayarları şu şekilde değiştirir:
- Günlük grafikler için 10, 30, 60
- Daha muhafazakar sinyaller için 20, 60, 120
- Batı piyasaları için 7, 22, 44 (5 günlük ticaret haftası)
Sonuç
Ichimoku Bulutu, piyasa bilgilerini tek bir görünümde çok katmanlı olarak sunan kapsamlı bir ticaret sistemi sunar. Güçlü kılan sadece bireysel sinyaller değil, birden fazla göstergenin birlikte çalışmasıdır. Tüm bileşenler uyumlu olduğunda, Ichimoku sistemi net tanımlanmış risk parametreleriyle yüksek olasılıklı ticaret fırsatları sağlayabilir.
Başlangıçta karmaşık görünse de, pratikle tüccarlar Hosoda'nın amaçladığı gibi piyasa koşullarını "bir bakışta" değerlendirebilirler. Sistem bileşenlerinin zaman kaydırmalı yapısı, piyasa dinamiklerine benzersiz bir bakış açısı sunar ve tüccarların potansiyel gelecekteki destek ve direnç seviyelerini, bunlar geçerli olmadan önce görmelerine olanak tanır.
Özet
1. Tenkan-sen (Conversion Line): short-term momentum indicator and dynamic support/resistance.
2. Kijun-sen (Base Line): medium-term momentum indicator and stronger support/resistance, also used as a trailing stop.
3. Senkou Span A (Leading Span A): forms the leading edge of the cloud (Kumo), projected 26 periods ahead.
4. Senkou Span B (Leading Span B): forms the trailing edge of the cloud, projected 26 periods ahead.
5. Chikou Span (Lagging Span): current closing price plotted 26 periods back, confirming trends and potential reversals.
The cloud (Kumo), formed between Senkou Span A and B, represents support and resistance zones, with thickness indicating volatility and strength. The indicator provides trend determination, entry and exit signals, and support/resistance levels. It is applicable across various markets including Forex, stocks, commodities, cryptocurrencies, and indices, and works best in trending markets and multiple time frames. Risk management features include dynamic stop-loss levels based on the cloud and position sizing adjustments according to cloud thickness. Traditional settings are (9, 26, 52) periods, with common adjustments for different trading weeks.


!["[CB] Pivot Points Pro" logosu](https://cdn.ctrader.com/image/webp/43463c82-67b0-4f10-a4ba-901bba091d81_32594)


