Açıklama
Darvas Kutusu Teorisi
Darvas Kutusu teorisi, Nicolas Darvas tarafından 1950'lerde geliştirilen bir ticaret tekniğidir. Bu, piyasada potansiyel giriş ve çıkış noktalarını belirlemek için fiyat hareketini kullanan momentum tabanlı bir ticaret stratejisidir.
Darvas Kutusu Nasıl Çalışır
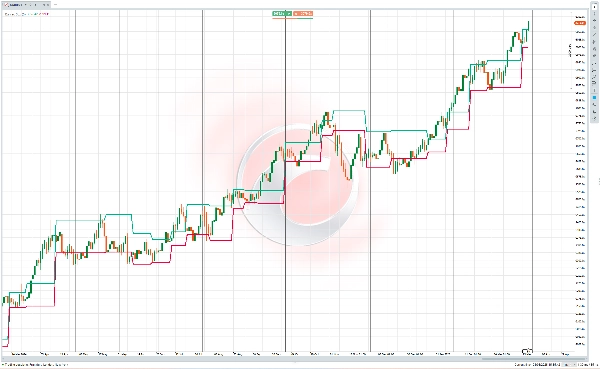
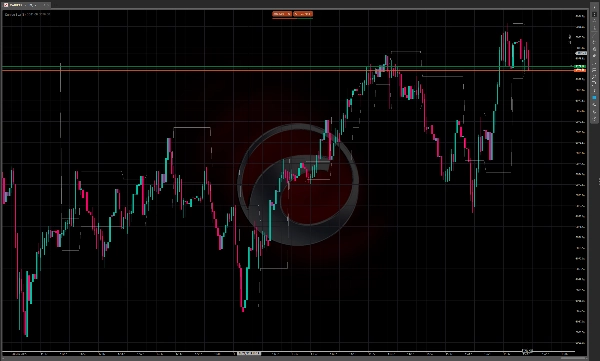
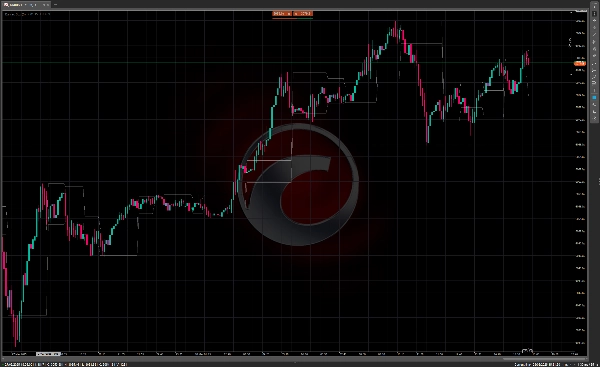
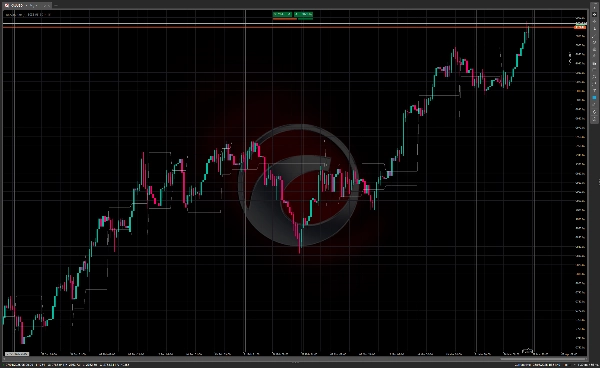
Darvas Kutusu yöntemi, bir hissenin fiyatının kırılmadan önce konsolide olduğu "kutuları" veya ticaret aralıklarını tanımlamayı içerir. Ana bileşenler şunlardır:
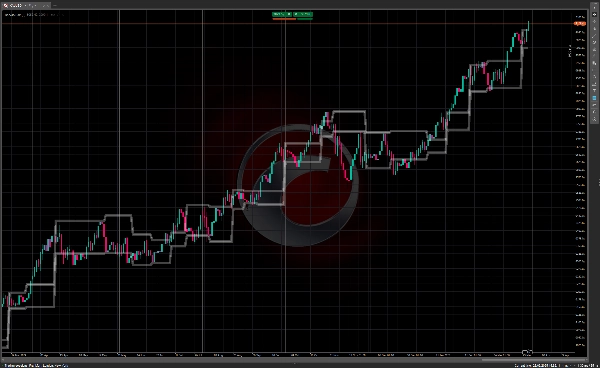
- Fiyat, belirgin üst ve alt sınırlarla tanımlanmış bir ticaret aralığı (\"kutu\") oluşturur
- Üst sınır direnç, alt sınır ise destek olarak görev yapar
- Kutunun üzerindeki bir kırılma potansiyel bir alım fırsatını işaret eder
- Kutunun altındaki bir düşüş satış sinyali olarak kullanılabilir
Bu tekniği kullanan yatırımcılar genellikle fiyat hareketiyle birlikte artan hacim gösteren hisseleri ararlar, çünkü bu, kırılmanın arkasında daha güçlü bir momentum olduğunu gösterir.
Darvas Kutusu Teorisinin Tarihi
Nicolas Darvas (1920-1977), ticaret tarihinde oldukça sıra dışı bir figürdü. Macaristan'da doğan Darvas, eğitimli bir profesyonel tüccar değil, yarı kız kardeşiyle birlikte "Darvas ve Julia" adlı bir salon dansı ikilisi olarak performans sergileyen bir dansçıydı.
1950'lerde dans topluluğuyla dünya turu yaparken, Darvas hisse senedi ticaretiyle denemeler yapmaya başladı. Koşulları benzersizdi—tur sırasında çeşitli şehirlerde kendisine teslim edilen gazetelerdeki hisse senedi tablolarına dayanarak yatırım kararları alıyordu.
Darvas, kutu teorisini deneme yanılma yoluyla geliştirdi. Başlangıçta piyasalarda para kaybetti ancak yaklaşımını yavaş yavaş geliştirdi. 1956 ile 1958 arasında, kutu yöntemiyle 10.000 dolarlık bir yatırımı 2 milyon doların üzerine çıkardığı bildirildi—dikkat çeken olağanüstü bir başarı.
1960'ta Darvas, yöntemlerini "How I Made $2,000,000 in the Stock Market" adlı kitapta yayımladı; bu kitap ticaret literatüründe klasik haline geldi. Kitap, yolculuğunu detaylandırdı ve kutu teorisini açıkladı, bu yaklaşımı ana akıma taşıdı.
Darvas'ın yöntemini özellikle dikkat çekici kılan, sadeliği ve finans endüstrisi dışından biri tarafından geliştirilmiş olmasıydı. Temel analiz yerine öncelikle fiyat hareketi ve hacme odaklandı; bu yaklaşım o zamanlar biraz yeniydi ancak sonrasında birçok teknik ticaret sistemini etkiledi.
Darvas Kutusu tekniği, özellikle trend piyasalarında momentum tabanlı stratejileri takip eden teknik yatırımcılar arasında bugün hâlâ popülerdir.