
Descrizione
La Guida Completa all'Analisi con la Nuvola Ichimoku
Storia e Contesto
L'Ichimoku Kinko Hyo (o Nuvola Ichimoku) è stato sviluppato dal giornalista giapponese Goichi Hosoda alla fine degli anni '30. Dopo anni di ricerca e backtesting con un team di assistenti, Hosoda pubblicò i suoi risultati nel 1969. Il nome "Ichimoku Kinko Hyo" si traduce in "grafico di equilibrio a colpo d'occhio", che riflette il suo scopo: permettere ai trader di valutare rapidamente molteplici aspetti dell'azione di mercato in una singola vista.
L'innovazione di Hosoda fu notevole poiché creò questo sistema complesso decenni prima che l'analisi al computer fosse disponibile, eseguendo tutti i calcoli a mano. Ciò che rende unico il sistema Ichimoku è il suo approccio olistico, integrando molteplici timeframe e dimensioni dell'analisi di mercato in un quadro unificato.
I Cinque Componenti della Nuvola Ichimoku
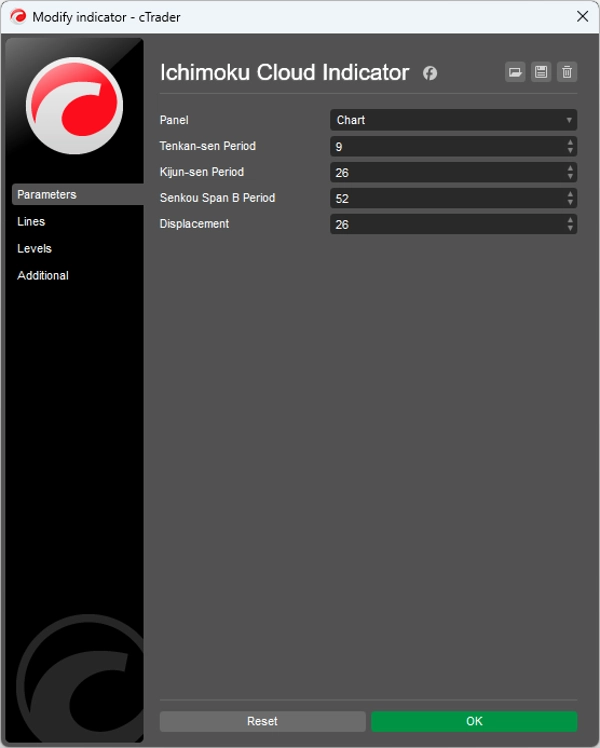
La Nuvola Ichimoku è composta da cinque linee distinte, ognuna delle quali fornisce specifiche informazioni:
1. Tenkan-sen (Linea di Conversione)
- Calcolo: (Massimo più alto + Minimo più basso) / 2 per gli ultimi 9 periodi
- Funzione: Rappresenta il momentum di breve termine del mercato
- Interpretazione: Agisce come livello dinamico di supporto/resistenza e indicatore di trend
2. Kijun-sen (Linea Base)
- Calcolo: (Massimo più alto + Minimo più basso) / 2 per gli ultimi 26 periodi
- Funzione: Rappresenta il momentum di medio termine del mercato
- Interpretazione: Agisce come livello di supporto/resistenza più forte e può servire come trailing stop
3. Senkou Span A (Leading Span A)
- Calcolo: (Tenkan-sen + Kijun-sen) / 2, tracciato 26 periodi avanti
- Funzione: Forma il bordo anteriore della nuvola (Kumo)
- Interpretazione: Livello di supporto/resistenza proiettato
4. Senkou Span B (Leading Span B)
- Calcolo: (Massimo più alto + Minimo più basso) / 2 per gli ultimi 52 periodi, tracciato 26 periodi avanti
- Funzione: Forma il bordo posteriore della nuvola (Kumo)
- Interpretazione: Livello di supporto/resistenza proiettato
5. Chikou Span (Lagging Span)
- Calcolo: Prezzo di chiusura corrente, tracciato 26 periodi indietro
- Funzione: Conferma i trend e identifica potenziali inversioni
- Interpretazione: Quando è sopra l'azione del prezzo, rialzista; quando è sotto, ribassista
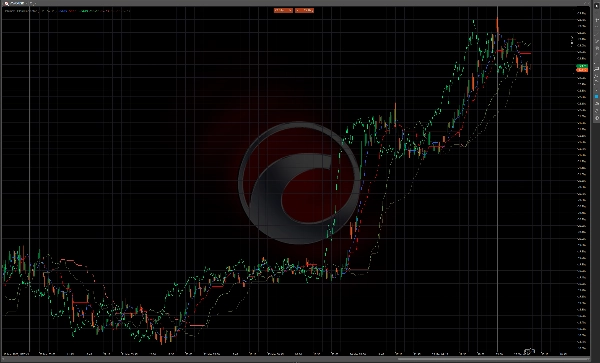
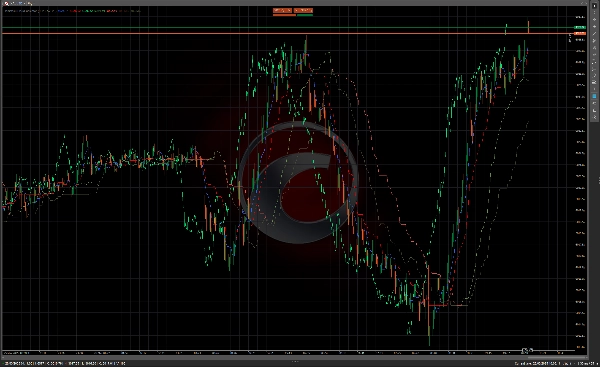
Il Kumo (Nuvola)
L'area tra Senkou Span A e Senkou Span B è chiamata "Kumo" o nuvola. La nuvola rappresenta potenziali zone di supporto e resistenza e il suo spessore indica la volatilità del mercato e la forza di queste zone.
- Nuvola Spessa: Supporto/resistenza forte, maggiore volatilità
- Nuvola Sottile: Supporto/resistenza più debole, minore volatilità
- Nuvola Rialzista: Senkou Span A sopra Senkou Span B (spesso colorata di verde)
- Nuvola Ribassista: Senkou Span B sopra Senkou Span A (spesso colorata di rosso)
Regole e Segnali di Trading
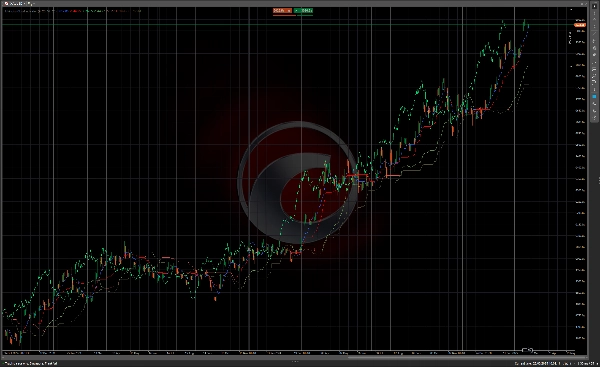
Determinazione del Trend
- Criteri per Trend Rialzista:
-
- Il prezzo è sopra la nuvola
- Tenkan-sen è sopra Kijun-sen
- Chikou Span è sopra il prezzo di 26 periodi fa
- Senkou Span A è in aumento e sopra Senkou Span B (nuvola rialzista)
- Criteri per Trend Ribassista:
-
- Il prezzo è sotto la nuvola
- Tenkan-sen è sotto Kijun-sen
- Chikou Span è sotto il prezzo di 26 periodi fa
- Senkou Span A è in discesa e sotto Senkou Span B (nuvola ribassista)
- Mercato Neutro/Range-bound:
-
- Il prezzo è all'interno della nuvola
- Tenkan-sen e Kijun-sen sono piatti o si incrociano frequentemente
Segnali di Entrata
Segnali di Entrata Rialzisti
- Incrocio TK (Incrocio Tenkan/Kijun):
-
- Tenkan-sen incrocia sopra Kijun-sen
- Più efficace quando il prezzo è sopra la nuvola
- Segnale più forte quando la nuvola è rialzista
- Rottura del Kumo:
-
- Il prezzo rompe sopra la nuvola dopo essere stato sotto o al suo interno
- Segnale più forte quando la nuvola avanti è rialzista (Senkou Span A > Senkou Span B)
- Conferma Chikou Span:
-
- Chikou Span incrocia sopra il prezzo di 26 periodi fa
- Nessuna resistenza davanti per Chikou Span
Segnali di Entrata Ribassisti
- Incrocio TK (Ribassista):
-
- Tenkan-sen incrocia sotto Kijun-sen
- Più efficace quando il prezzo è sotto la nuvola
- Segnale più forte quando la nuvola è ribassista
- Rottura del Kumo (Ribassista):
-
- Il prezzo rompe sotto la nuvola dopo essere stato sopra o al suo interno
- Segnale più forte quando la nuvola avanti è ribassista (Senkou Span B > Senkou Span A)
- Conferma Chikou Span (Ribassista):
-
- Chikou Span incrocia sotto il prezzo di 26 periodi fa
- Nessun supporto davanti per Chikou Span
Segnali di Uscita
- Inversione di Trend: Quando iniziano ad apparire i criteri per il trend opposto
- Incrocio TK: Quando Tenkan-sen incrocia Kijun-sen nella direzione opposta
- Tocco della Nuvola: Quando il prezzo tocca il lato opposto della nuvola
- Avviso Chikou Span: Quando Chikou Span si avvicina a livelli di prezzo storici
Livelli di Supporto e Resistenza
- Supporto/Resistenza Immediato: Tenkan-sen e Kijun-sen
- Supporto/Resistenza di Medio Termine: La nuvola (più forte nelle sezioni piatte)
- Kumo Twist: Quando Senkou Span A e B si incrociano, creando potenziali punti di inversione
Tecniche Avanzate di Ichimoku
1. Kumo Twist (Torsione della Nuvola)
Un Kumo Twist si verifica quando Senkou Span A e B si incrociano, creando un potenziale punto di inversione 26 periodi nel futuro. I trader spesso lo usano come segnale di allerta precoce per potenziali cambi di trend.
2. Analisi dei Time Frame
Molti trader Ichimoku analizzano più time frame:
- Time frame superiore per la direzione generale del trend
- Time frame medio per i segnali di entrata
- Time frame inferiore per il timing preciso dell'entrata
3. Allargamento/Riduzione di Senkou Span
- Nuvola in Allargamento: Aumento della volatilità di mercato, trend più forte
- Nuvola in Riduzione: Diminuzione della volatilità, potenziale indebolimento del trend
4. Kumo Piatto (Nuvola Piatta)
Quando entrambi i Senkou Span corrono paralleli, spesso indica un trend forte con chiari livelli di supporto/resistenza.
Applicazioni Pratiche
Condizioni di Mercato Ideali
La Nuvola Ichimoku funziona meglio in mercati in trend e su tutti i time frame. Può essere applicata a:
- Forex
- Azioni
- Materie prime
- Criptovalute
- Indici
Gestione del Rischio
- Usa la nuvola come livello dinamico di stop-loss
- Regola la dimensione della posizione in base allo spessore della nuvola (nuvola più spessa = maggiore volatilità)
- Considera Kijun-sen come trailing stop in trend forti
Compatibilità con i Timeframe
Le impostazioni tradizionali (9, 26, 52) si basavano sulla settimana di trading giapponese (che aveva 6 giorni), quindi alcuni trader adattano queste impostazioni:
- 10, 30, 60 per grafici giornalieri
- 20, 60, 120 per segnali più conservativi
- 7, 22, 44 per mercati occidentali (settimana di trading di 5 giorni)
Conclusione
La Nuvola Ichimoku offre un sistema di trading completo che fornisce molteplici livelli di informazioni di mercato in una singola vista. Ciò che lo rende potente non sono solo i segnali individuali ma la confluenza di molteplici indicatori che lavorano insieme. Quando tutti i componenti si allineano, il sistema Ichimoku può offrire opportunità di trading ad alta probabilità con parametri di rischio chiaramente definiti.
Sebbene inizialmente possa sembrare complesso, con la pratica i trader possono effettivamente valutare le condizioni di mercato "a colpo d'occhio" come intendeva Hosoda. I componenti temporali del sistema forniscono anche una prospettiva unica sulla dinamica di mercato, permettendo ai trader di vedere potenziali livelli futuri di supporto e resistenza prima che diventino rilevanti.
Riepilogo
1. Tenkan-sen (Conversion Line): short-term momentum indicator and dynamic support/resistance.
2. Kijun-sen (Base Line): medium-term momentum indicator and stronger support/resistance, also used as a trailing stop.
3. Senkou Span A (Leading Span A): forms the leading edge of the cloud (Kumo), projected 26 periods ahead.
4. Senkou Span B (Leading Span B): forms the trailing edge of the cloud, projected 26 periods ahead.
5. Chikou Span (Lagging Span): current closing price plotted 26 periods back, confirming trends and potential reversals.
The cloud (Kumo), formed between Senkou Span A and B, represents support and resistance zones, with thickness indicating volatility and strength. The indicator provides trend determination, entry and exit signals, and support/resistance levels. It is applicable across various markets including Forex, stocks, commodities, cryptocurrencies, and indices, and works best in trending markets and multiple time frames. Risk management features include dynamic stop-loss levels based on the cloud and position sizing adjustments according to cloud thickness. Traditional settings are (9, 26, 52) periods, with common adjustments for different trading weeks.


