
الوصف
CVD ai
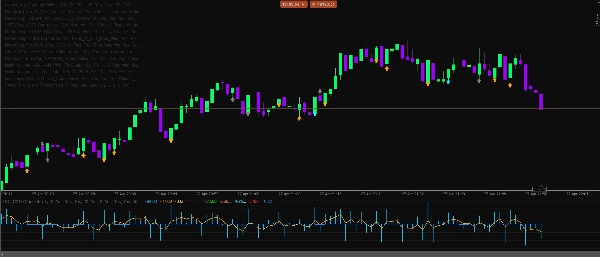
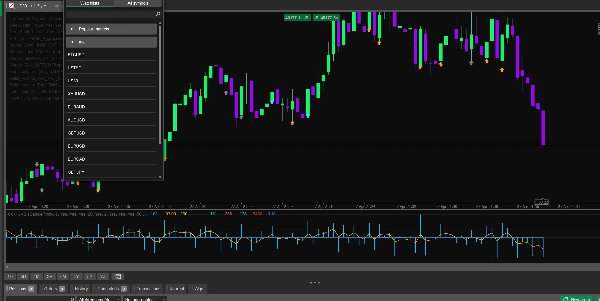
Delta CVD Advanced هو مؤشر محترف لتحليل الزخم والأوامر مصمم للمتداولين الذين يرغبون في رؤية أوضح لضغط الشراء والبيع مباشرة من سلوك السوق. يجمع بين دلتا، CVD، زخم التيك المباشر، الامتصاص، التباعد، مرشحات الجلسة، حراس التقلب، ومحرك التلاقي الذكي في أداة تحليلية واحدة نظيفة.
تم بناء هذا المؤشر للتداول السريع، التداول اليومي، وتأكيد الزخم قصير الأجل عبر أسواق الفوركس، الذهب، المؤشرات، العملات المشفرة، والنفط.
الميزات الرئيسية
- حساب دلتا مباشر باستخدام منطق ارتفاع/انخفاض التيك
- وضع دلتا وكيل الشمعة للتحليل التاريخي
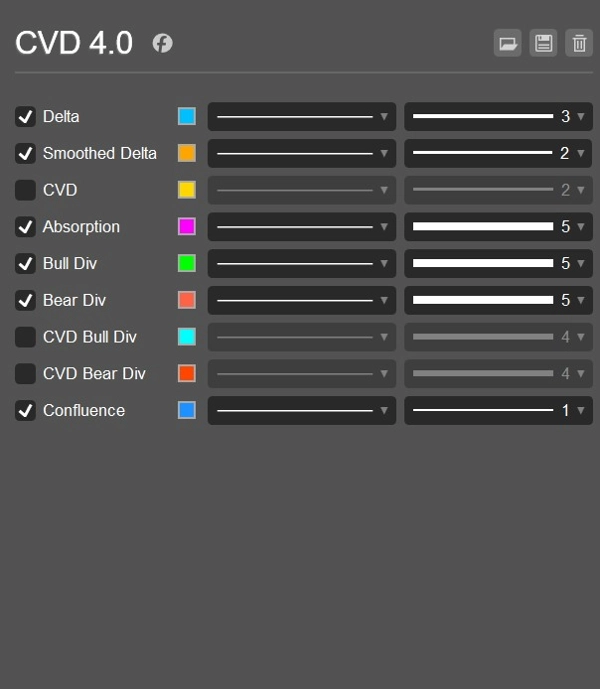
- خط دلتا الحجم التراكمي لتتبع الضغط مع مرور الوقت
- خط دلتا مملس لقراءة زخم أنظف
- مخطط دلتا ملون للشراء/البيع
- حساب الزخم بناءً على التيك للنبضات السوقية الحية
- وضع زخم هجين يجمع بين ميل CVD ونبضة التيك
- خيارات إعادة تعيين CVD: أبداً، يومياً، أو حسب الجلسة
- كشف التباعد الصاعد والهابط للدلتا
- كشف التباعد الصاعد والهابط لـ CVD
- كشف الامتصاص لرصد الضغط الذي يفشل في تحريك السعر
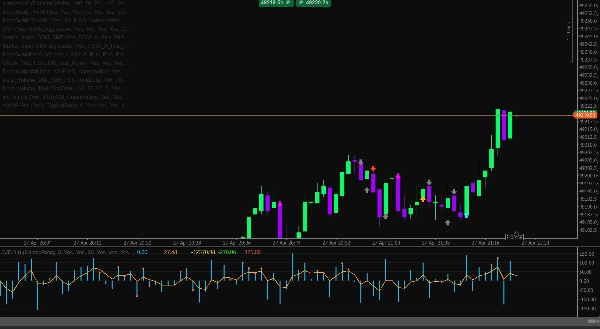
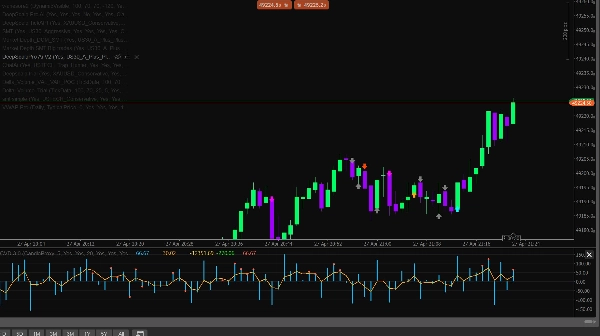
- أسهم إشارة لفرص الشراء والبيع
- أسهم التنبؤ لتحذيرات مبكرة بتحول الزخم
- تأكيد CVD اختياري للإشارات
- محرك تلاقي ذكي مع تسجيل اتجاهي
- مرشح ضغط وكيل DOM
- مرشح كشف المسح لالتقاط السيولة
- مرشحات الجلسة لآسيا، لندن، ونيويورك
- كشف الجلسة التلقائي باستخدام توقيت UTC
- حارس التقلب باستخدام حدود ATR
- حارس الفارق لتجنب ظروف السوق السيئة
- مرشح نسبة الحجم لتجنب الإشارات الضعيفة ذات الحجم المنخفض
- إعدادات رموز مسبقة للفوركس، الذهب، المؤشرات، العملات المشفرة، والنفط
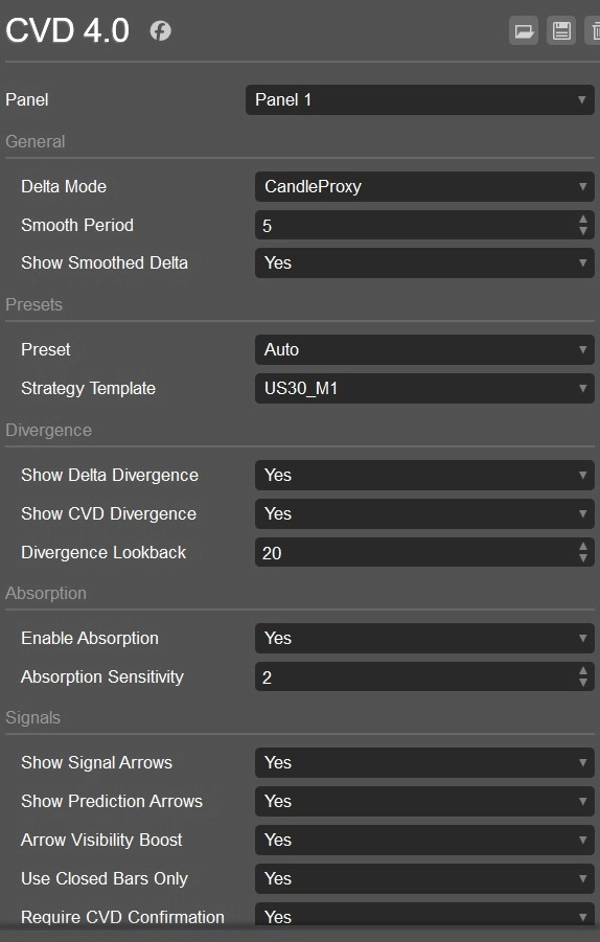
- قوالب استراتيجيات لـ US30 M1، USTECH M1، XAUUSD M1، BTCUSD M1، والنفط M1
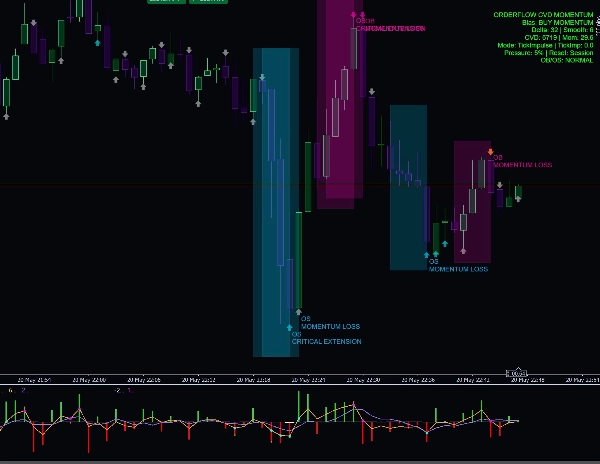
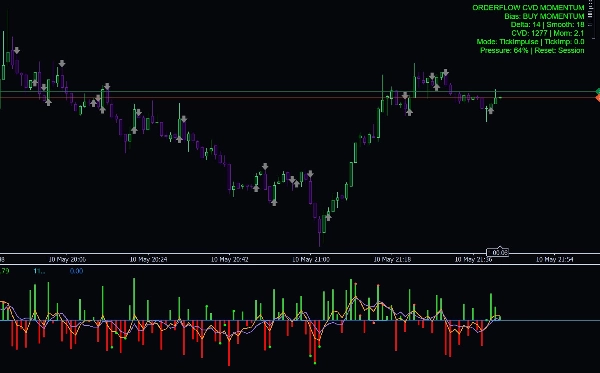
- لوحة معلومات تعرض الانحياز، دلتا، دلتا المملس، CVD، الزخم، نسبة الضغط، ووضع إعادة التعيين
- تنبيهات السجل الاختيارية مع التحكم في فترة التهدئة
لماذا يستخدمه المتداولون
يساعد Delta CVD Advanced المتداولين على فهم من يسيطر حالياً: المشترين أم البائعين. بدلاً من الاعتماد فقط على شموع السعر، يحلل المؤشر الضغط وراء الحركة. هذا يجعله مفيدًا لتأكيد الدخول، تجنب الإشارات الضعيفة، تحديد الانعكاسات، رصد الامتصاص، واكتشاف تحولات الزخم قبل أن تصبح واضحة على السعر.
وضع زخم التيك مفيد بشكل خاص للتداول السريع لأنه يتفاعل مع نبضات السعر في الوقت الحقيقي، بينما تساعد أدوات CVD والدلتا المملس في تأكيد ما إذا كانت الحركة تحمل قوة حقيقية خلفها.
أفضل استخدام له
- التداول السريع
- التداول اليومي
- تأكيد الزخم
- تأكيد الانعكاس
- تحليل مسح السيولة
- تداول التباعد بين دلتا و CVD
- الذهب، المؤشرات، العملات المشفرة، النفط، وأزواج الفوركس
- M1، M5، والأطر الزمنية الأدنى الأخرى
إشعار مهم
هذا المؤشر هو أداة دعم قرار تحليلي. لا يضمن الأرباح ويجب استخدامه مع إدارة مخاطر مناسبة، هيكل السوق، وخطة تداول مجربة.
الملخص
Additional functionalities include detection of bullish and bearish Delta and CVD divergences, absorption detection to identify pressure that fails to move price, and signal arrows for buy/sell opportunities alongside prediction arrows for early momentum shifts. It incorporates session filters for Asia, London, and New York trading sessions, volatility and spread guards, volume ratio filters, and a smart confluence engine with directional scoring.
CVD Ai supports markets such as Forex, Gold, Indices, Crypto, and Oil, and is optimized for scalping, intraday trading, and short-term momentum confirmation on lower timeframes like M1 and M5. It offers strategy templates for specific symbols including US30, USTECH, XAUUSD, BTCUSD, and Oil. The indicator includes an info dashboard displaying bias, Delta, smoothed Delta, CVD, momentum, pressure percentage, and reset mode options.
تقييمات العملاء
5 | 0 % | |
4 | 100 % | |
3 | 0 % | |
2 | 0 % | |
1 | 0 % |


