
الوصف
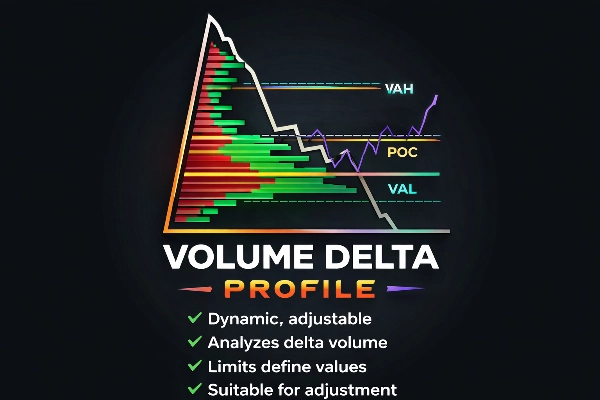
ملف دلتا الحجم
رؤية احترافية لتدفق الأوامر للمتداولين المتقدمين
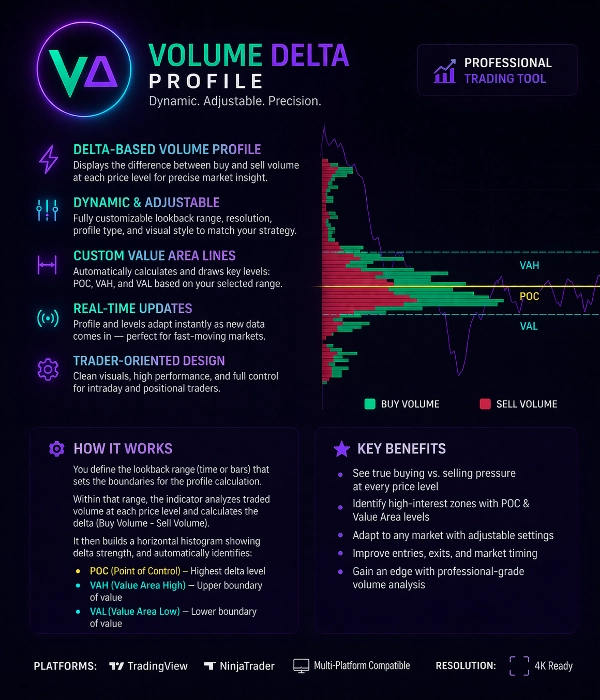
ملف دلتا الحجم هو أداة تداول قوية مصممة لكشف التوازن الحقيقي بين المشترين والبائعين عند كل مستوى سعري.
على عكس ملفات الحجم التقليدية، يقوم هذا المؤشر بتحليل حجم الدلتا (حجم الشراء – حجم البيع) ليُظهر أين يهيمن المشاركون العدوانيون في السوق.
يساعد المتداولين على تحديد النشاط المؤسسي، مناطق الامتصاص، ومستويات الأسعار ذات الاهتمام العالي بدقة.
الميزات الأساسية
ملف الحجم المبني على الدلتا
يقوم المؤشر بحساب دلتا الحجم عند كل مستوى سعري، مفصلاً:
• ضغط الشراء العدواني
• ضغط البيع العدواني
هذا يكشف من يسيطر فعليًا على السوق.
نطاق ملف ديناميكي وقابل للتعديل
نطاق حساب الملف هو قابل للتخصيص بالكامل.
يمكن للمستخدمين تحديد منطقة الحساب عن طريق:
• نطاق الأعمدة المخصص
• نطاق الجلسة
• التحديد اليدوي
• النطاق الديناميكي المتداول
يقوم الملف تلقائيًا بالتحديث مع وصول بيانات جديدة.
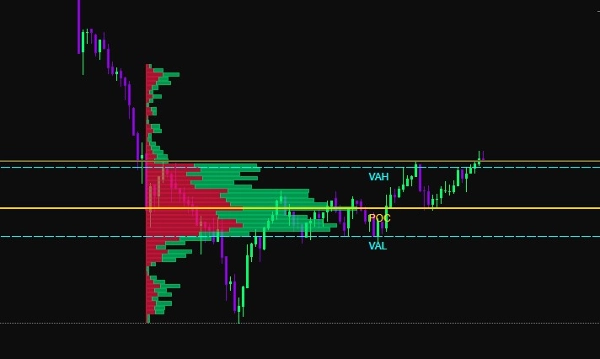
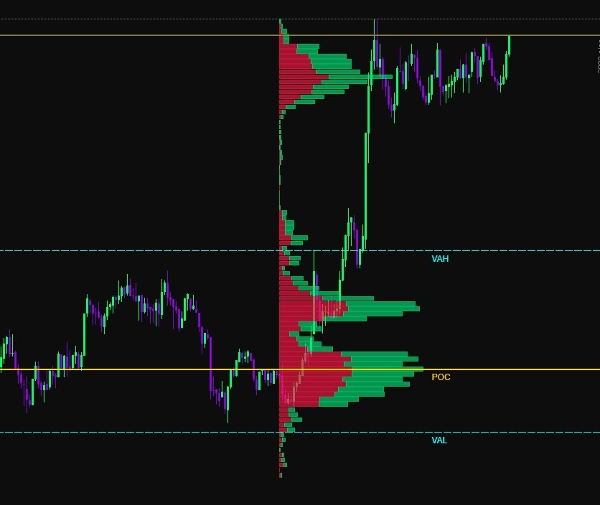
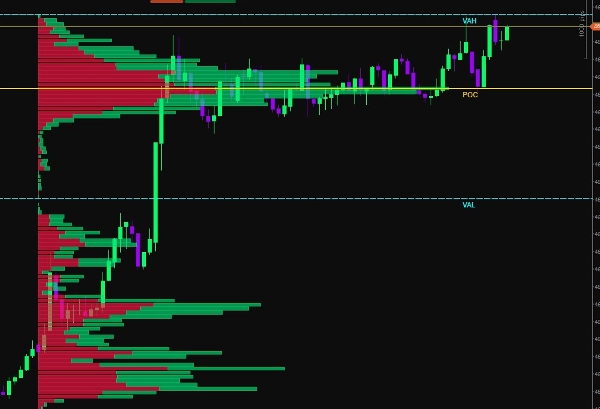
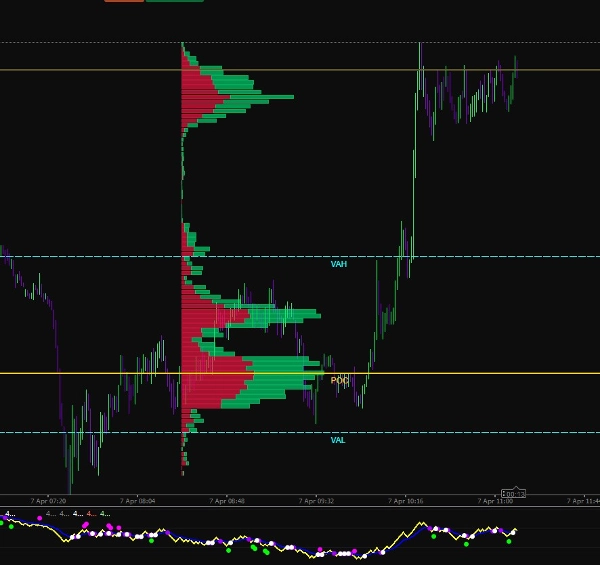
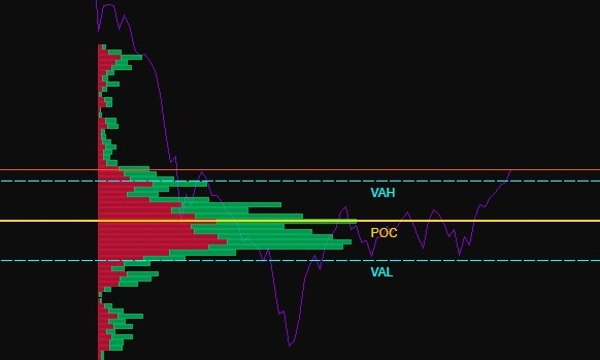
كشف منطقة القيمة
يقوم المؤشر تلقائيًا بحساب مستويات هيكل السوق الرئيسية:
POC (نقطة السيطرة)
المستوى السعري الذي يحتوي على أعلى حجم دلتا متداول.
VAH (أعلى منطقة القيمة)
الحد الأعلى لمنطقة القيمة.
VAL (أدنى منطقة القيمة)
الحد الأدنى لمنطقة القيمة.
تُبرز هذه المستويات أين حدثت غالبية نشاط السوق.
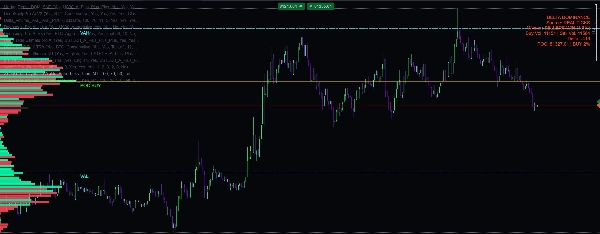
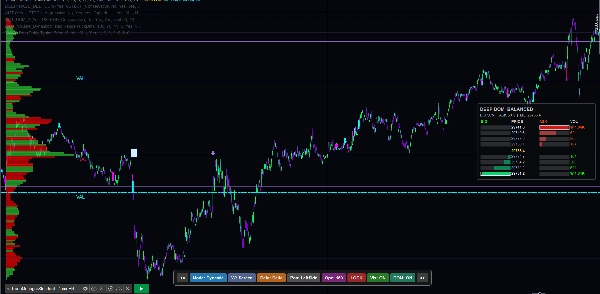
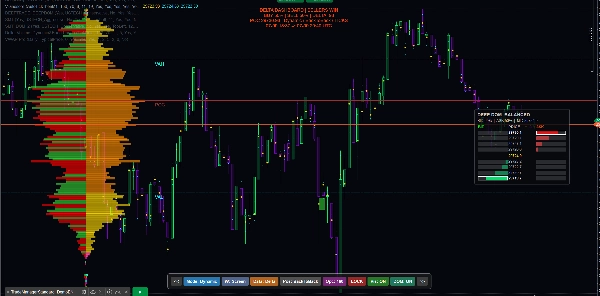
تصور الشراء مقابل البيع
يُعرض الحجم كـ مخطط بياني أفقي:
الأعمدة الخضراء → حجم الشراء المسيطر
الأعمدة الحمراء → حجم البيع المسيطر
هذا يسمح للمتداولين برؤية فوراً:
• مناطق الامتصاص
• مناطق عدم التوازن
• تجمعات السيولة
• آثار المؤسسات
تصور تكيفي
يتضمن المؤشر خيارات تخصيص بصرية متعددة:
• عرض المخطط البياني قابل للتعديل
• مخططات ألوان مخصصة
• شفافية قابلة للتعديل
• التحكم في الدقة
• عرض متكيف مع التكبير
هذا يضمن تصورًا واضحًا على جميع أطر زمنية للرسوم البيانية.
مستويات الحدود الذكية
يرسم المؤشر مستويات مرجعية ديناميكية:
• خط POC
• خط VAH
• خط VAL
تُحدث هذه المستويات تلقائيًا بناءً على نطاق الملف المحدد ويمكن استخدامها كـ:
• دعم / مقاومة
• مناطق ارتداد المتوسط
• مستويات تأكيد الاختراق
الحساب في الوقت الحقيقي
يقوم ملف دلتا الحجم بإعادة الحساب باستمرار باستخدام بيانات السوق الحية.
هذا يضمن أن يرى المتداولون دائمًا معلومات تدفق الأوامر المحدثة خلال الأسواق السريعة.
حالات الاستخدام
هذه الأداة مثالية لـ:
• السكالبينج
• التداول اليومي
• تداول العقود الآجلة
• تحليل تدفق الأوامر
• تتبع السيولة
• اكتشاف آثار المؤسسات
المزايا الرئيسية للتداول
✔ تحديد ضغط الشراء مقابل البيع الحقيقي
✔ اكتشاف مناطق الامتصاص والإرهاق
✔ تحديد مستويات السيولة العالية
✔ تحسين دقة الدخول
✔ تأكيد الاختراقات أو الانعكاسات
✔ فهم هيكل السوق
المواصفات التقنية
طريقة الحساب:
دلتا الحجم = حجم الشراء − حجم البيع
نوع الملف:
مخطط بياني أفقي لمستوى السعر
المستويات التلقائية:
POC، VAH، VAL
وضع التحديث:
تحديث ديناميكي في الوقت الحقيقي
الإعدادات المخصصة:
• نطاق الملف
• دقة المخطط البياني
• مقياس الحجم
• إعدادات الألوان
• رؤية المستويات
توافق المنصة:
محسن لـ عرض الرسوم البيانية عالي الأداء
مصمم للمتداولين المحترفين
تم بناء ملف دلتا الحجم للمتداولين الذين يرغبون في تجاوز المؤشرات الأساسية و فهم الآليات الحقيقية للسوق.
من خلال الجمع بين تحليل الحجم، حساب الدلتا، وهيكل منطقة القيمة، توفر هذه الأداة رؤية واضحة لمشاركة السوق وتوزيع السيولة.
الملخص
Users can customize the profile calculation range using options such as custom bar range, session range, manual selection, or rolling dynamic range, with real-time updates as new market data arrives. Key market structure levels—Point of Control (POC), Value Area High (VAH), and Value Area Low (VAL)—are automatically calculated and drawn as dynamic reference lines, useful for support/resistance, mean reversion, and breakout confirmation.
Additional features include adjustable histogram width, color schemes, transparency, resolution control, and zoom-adaptive rendering for clear visualization across all chart timeframes. The tool supports use cases like scalping, intraday trading, futures trading, order flow analysis, liquidity tracking, and institutional footprint detection. It is optimized for high-performance chart rendering and aims to provide traders with precise insights into market participation and liquidity distribution.


