Descrição
LogicLadder Pivots – Scanner Avançado de Estrutura de Mercado e Padrões
Desbloqueie a estrutura oculta do mercado com LogicLadder Pivots.
O LogicLadder Pivots é uma ferramenta profissional de price action projetada para ajudar os traders a visualizar a estrutura do mercado, identificar tendências e detectar automaticamente padrões de reversão de alta probabilidade. Combinando a lógica clássica ZigZag com monitoramento avançado em múltiplos períodos de tempo, esta ferramenta atua como seu analista pessoal de mercado, mantendo seus gráficos limpos enquanto alerta sobre movimentos críticos de preço.
🚀 Principais Recursos
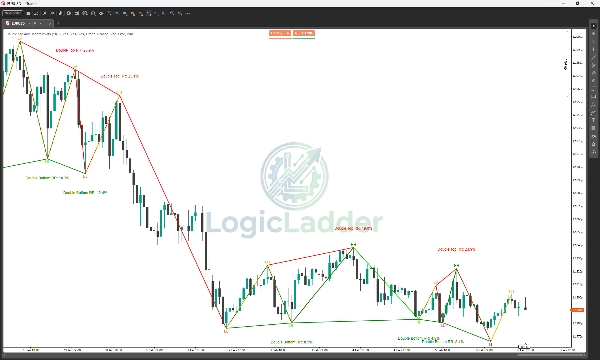
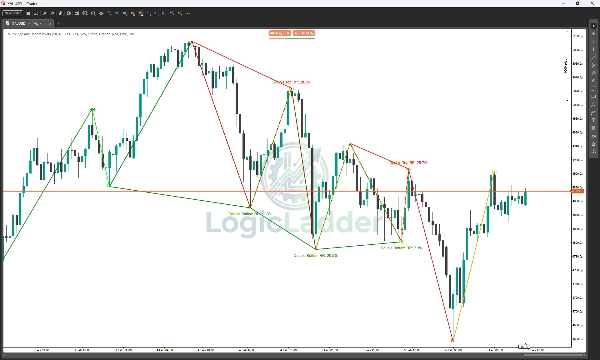
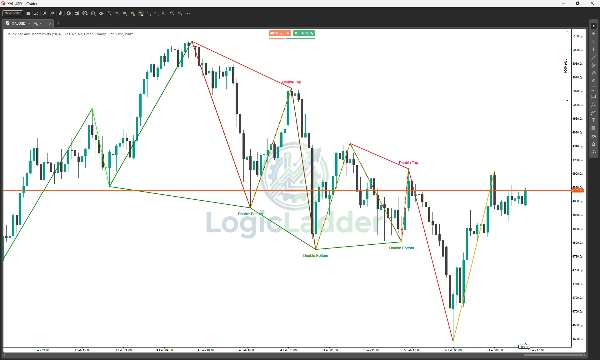
- Estrutura de Mercado Automatizada: Rotula automaticamente Higher Highs (HH), Lower Highs (LH), Higher Lows (HL) e Lower Lows (LL), fornecendo uma leitura instantânea da direção da tendência atual.
- Detecção Inteligente de Padrões: Escaneia em tempo real formações de Double Top e Double Bottom. Não apenas encontra padrões; filtra-os com base em uma razão calculada de Risco-Retorno (RR) para garantir que você veja apenas os setups mais acionáveis.
- Alertas Multi-Período (MTF): Monitore um período maior (ex: H4 ou Diário) enquanto negocia em um período menor. O indicador alertará quando pivôs chave se formarem no seu período de observação, garantindo que você nunca negocie contra a tendência principal.
- Painel Interativo de Estatísticas: Um painel limpo no gráfico exibe o status atual da detecção de padrões (Escaneando, Double Top Detectado, etc.).
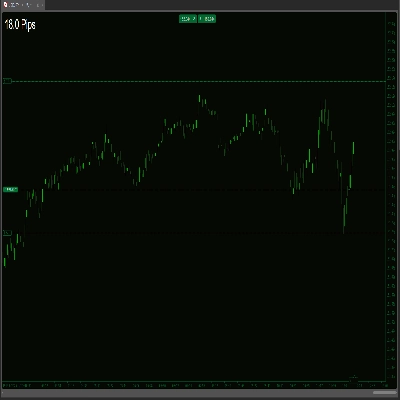
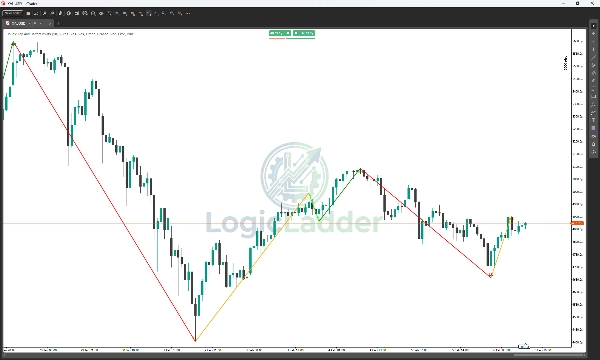
- Visualização ZigZag: Desenha linhas de tendência claras e personalizáveis que cortam o ruído, ajudando você a focar em oscilações significativas de preço.
- Totalmente Personalizável: Ajuste todos os aspectos do indicador ao seu estilo de negociação. Modifique a sensibilidade dos pivôs (Length), altere cores para estruturas de alta/baixa e ative ou desative elementos visuais distintos.
🎨 Guia Visual & Estratégia de Cores
O LogicLadder usa um código de 4 cores específico para contar instantaneamente a história da estrutura do mercado. Veja como ler a "Escada":
1. 🟢 Verde (Alta - Forte)
- O que é: Usado para Higher Highs (HH).
- O que significa: Os compradores estão no controle total. O mercado está fazendo novas máximas.
- Ação: Procure oportunidades de compra ou mantenha posições longas existentes.
2. 🔴 Vermelho (Baixa - Forte)
- O que é: Usado para Lower Lows (LL).
- O que significa: Os vendedores estão no controle total. O mercado está caindo para novas mínimas.
- Ação: Procure oportunidades de venda ou mantenha posições curtas existentes.
3. 🟠 Laranja (Armadilha de Alta - Fraqueza)
- O que é: Usado para Lower Highs (LH).
- O que significa: Os compradores tentaram empurrar o preço para cima, mas não conseguiram romper a máxima anterior. Esta é uma "Armadilha de Alta" — compradores tardios agora estão presos enquanto o momentum desaparece.
- Ação: Sinal de alerta! Se estiver comprado, considere realizar lucros. Fique atento para uma possível reversão de tendência para baixo.
4. 🟢 Lima (Armadilha de Baixa - Força)
- O que é: Usado para Higher Lows (HL).
- O que significa: Os vendedores tentaram empurrar o preço para baixo, mas não conseguiram romper a mínima anterior. Esta é uma "Armadilha de Baixa" — vendedores tardios estão presos enquanto o suporte se mantém.
- Ação: Sinal de oportunidade! Isso frequentemente indica o início de uma nova tendência de alta. Fique atento a sinais de entrada para comprar.
📉 Como Negociar a "Escada"
- Modo de Alta: Você quer ver um padrão de Verde (HH) conectado a Lima (HL). Isso confirma uma escada saudável em ascensão.
- Modo de Baixa: Você quer ver um padrão de Vermelho (LL) conectado a Laranja (LH). Isso confirma uma escada em queda acentuada.
- Identificação de Reversão:
-
- Topo Potencial: Se você vir um Verde (HH) seguido imediatamente por um Laranja (LH), a tendência de alta está perdendo força.
- Fundo Potencial: Se você vir um Vermelho (LL) seguido imediatamente por um Lima (HL), a pressão de venda está esgotada.
💡 Como Funciona
- Análise de Pivôs: O indicador analisa um período de lookback definido pelo usuário (padrão: 10 barras) para identificar máximas e mínimas significativas.
- Lógica de Tendência: Conecta esses pontos para visualizar a "Escada" do preço — mostrando exatamente quando uma tendência está quebrando a estrutura ou respeitando suporte/resistência.
- Confirmação de Reversão: Quando a ação do preço forma uma estrutura "W" (Double Bottom) ou "M" (Double Top) que atende aos seus critérios de Risco/Retorno, o indicador desenha o padrão no gráfico e atualiza o painel de status.
🔔 Alertas & Notificações
Mantenha-se informado sem precisar ficar olhando para a tela. LogicLadder Pivots inclui um sistema robusto de alertas:
- Alertas no Log: Mensagens detalhadas impressas no log do cTrader quando padrões ou pivôs ocorrem.
- Monitoramento MTF: Receba notificações quando um Pivot High ou Low estrutural se formar no timeframe de alerta escolhido (ex: receba um alerta para um Pivot Low de 4 horas enquanto faz scalping no gráfico de 5 minutos).
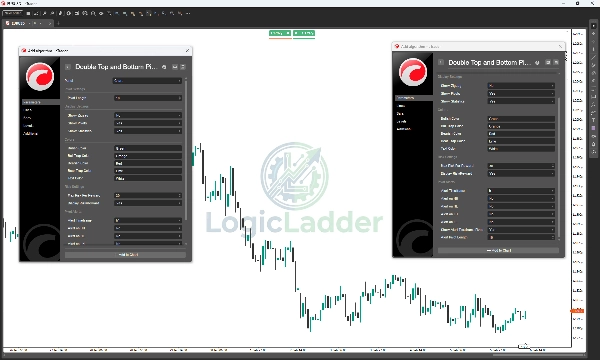
⚙️ Parâmetros
- Comprimento do Pivô: Sensibilidade da detecção de oscilações.
- Deslocamento do Rótulo: Ajusta a distância dos rótulos de texto em relação aos pavios das velas para melhor visibilidade.
- Risco Máximo por Recompensa: Filtra padrões com base na eficiência (padrão: 30%).
- Timeframe de Alerta: Escolha um timeframe secundário para monitorar.
- Configurações Visuais: Controle total sobre as cores para movimentos de Alta, Baixa e Armadilhas.
Resumo
The indicator detects Double Top and Double Bottom reversal patterns in real-time, filtering them by a calculated Risk-to-Reward ratio to highlight the most actionable setups. It supports alerts for pivot formations on higher timeframes while trading on lower ones, helping users align trades with major trends.
A customizable on-chart stats panel displays the current pattern detection status, and clear ZigZag trend lines visualize significant price swings. Users can adjust pivot sensitivity, label positioning, and color schemes for bullish, bearish, and trap moves to fit their trading style.
The tool employs a four-color system to represent market conditions: green for strong bullish moves (HH), red for strong bearish moves (LL), orange for bull traps (LH), and lime for bear traps (HL). This visual guide aids in spotting trend continuations and potential reversals. Alerts include detailed log messages and MTF notifications to keep traders informed.