
説明
🌟 MA Quant Volume Profile V2.0 フューチャリスティックエディション
プロのトレーダーのための革新的な市場分析ツール
🚀 V2.0の新機能 - フューチャリスティックエディション
革新的なインターフェース
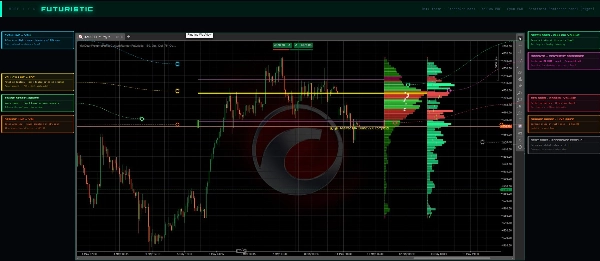
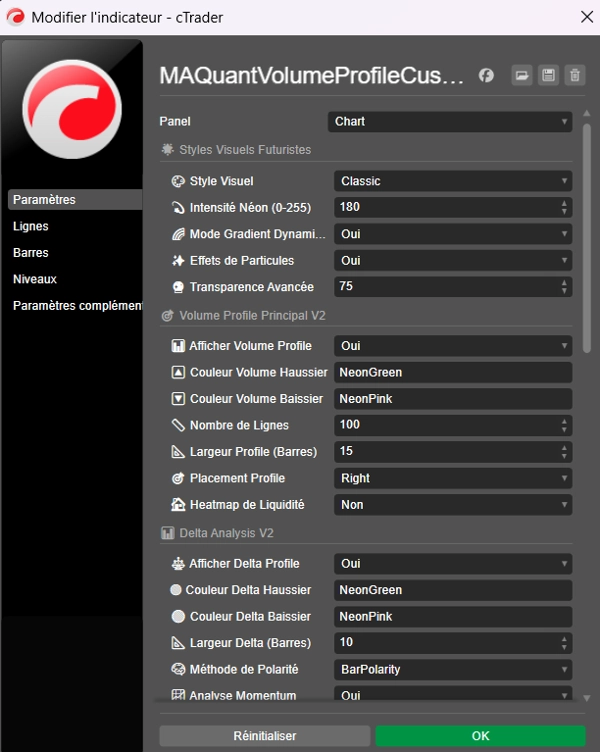
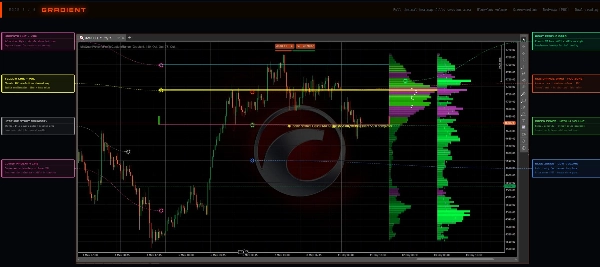
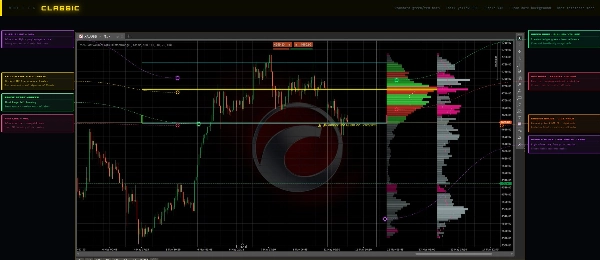
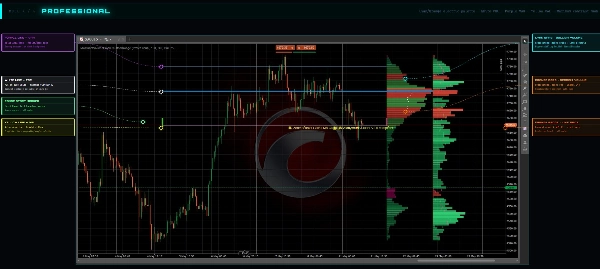
- 🎨 5つのフューチャリスティックビジュアルスタイル: フューチャリスティック、ネオン、プロフェッショナル、グラデーション、クラシック
- ⚡ ダイナミックなネオン効果: 高度な透明度で調整可能な強度(50-255)
- 🌈 アニメーション付きグラデーション: スムーズな遷移とサイバーパンクカラー
- ✨ パーティクル効果: アニメーション付きの高ボリューム可視化
- 🔮 ホログラフィックインターフェース: インテリジェントなリアルタイムコントロールパネル
高度な機関投資家分析
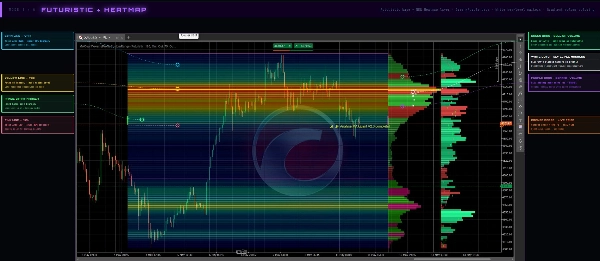
- 📊 流動性ヒートマップ: 活動の高いゾーンの熱的可視化
- ⚖️ プロフェッショナルデルタ分析: リアルタイムの買い手/売り手のセンチメント
- 📈 統合モメンタム分析: ボリューム加速検出
- 🧠 自動パターン検出: 市場の人工知能
- 🎯 マルチマーケットセッション: アジア、ロンドン、ニューヨーク、カスタム
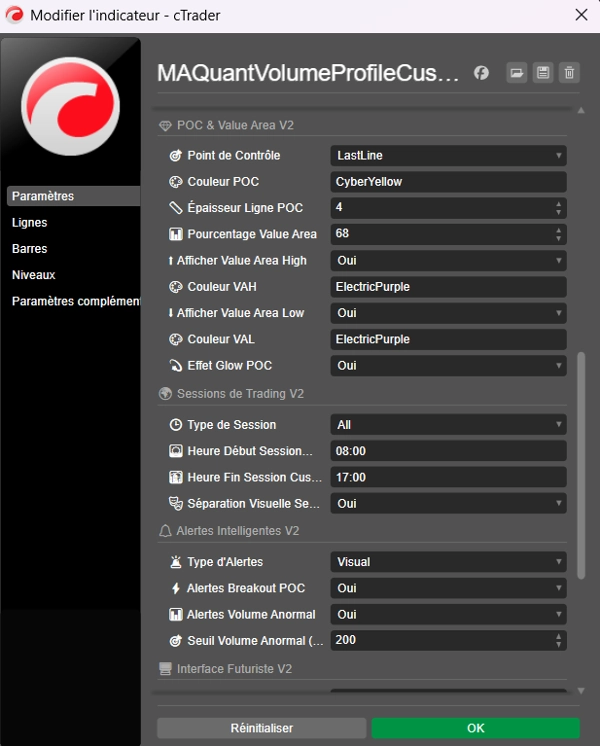
インテリジェントアラートシステム
- 🚨 視覚および音声アラート: POCのブレイクアウトと異常なボリューム
- ⚡ カスタマイズ可能な閾値: トリガーレベルの設定
- 📊 リアルタイム監視: 市場状況の継続的監視
- 🔔 即時通知: チャンスへの即応
💎 強化されたコア機能
高精度ボリュームプロファイル
- 🎯 カスタム分析ゾーン: 直感的なクリック選択
- 📏 最大200の価格レベル: 最大の粒度
- 🔼🔽 強気/弱気ボリューム分離: 正確な方向性分析
- 📐 調整可能なプロファイル幅: 右/左/中央の最適配置
プロフェッショナルポイントオブコントロール(POC)
- 🎯 POC開発および最終ライン: リアルタイム追跡または固定
- 💫 ネオングロー効果: 高度な視覚的強調
- 📏 カスタマイズ可能な太さ: 最適な視認性のための1-10ピクセル
- ⚡ ブレイクアウトアラート: レベル突破時の通知
機関投資家バリューエリア
- 📊 調整可能なパーセンテージ: 特定の戦略向けに0-100%
- ⬆️ バリューエリアハイ(VAH): 動的な抵抗
- ⬇️ バリューエリアロー(VAL): 動的なサポート
- 🎨 テーマカラー: 完璧なビジュアルコーディネーション
🎨 革新的なビジュアルスタイル
🌟 フューチャリスティック - デフォルト
ネオンカラーと高度な光効果を備えたサイバーパンクインターフェース
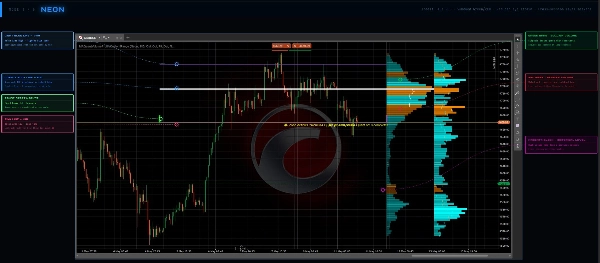
💫 ネオン
夜間取引向けの最大強度を持つ超明るいスタイル
💼 プロフェッショナル
洗練されたグラデーションと企業カラーを用いた機関投資家向けデザイン
🌈 グラデーション
マトリックスパレットと深みのある効果によるスムーズな遷移
⚪ クラシック
保守的な環境に適したクリーンで落ち着いたスタイル
🛠️ 高度なコントロール
インテリジェントインターフェース
- 📊 アニメーション進捗インジケーター: 4スタイル(リニア、サーキュラー、ネオン、マトリックス)
- 📈 リアルタイム統計: 即時パフォーマンス指標
- 💻 コントロールパネル: すべてのパラメーターの中央ハブ
- 🔍 高度なデバッグ: 3つの診断レベル(基本、標準、詳細)
セッション管理
- 🌍 マルチセッション: アジア(00:00-09:00)、ロンドン(07:00-16:00)、NY(13:00-22:00)
- 🕒 カスタムセッション: 特定の時間定義
- 🎭 視覚的セパレーター: 明確な期間区切り
⚡ パフォーマンスと最適化
高性能計算
- 🚀 最適化されたアルゴリズム: 超高速データ処理
- 📊 強化されたボリューム分布: 正確な計算方法
- 🔄 リアルタイム更新: 調整中の動的再計算
- 💾 データエクスポート: バックテスト用の分析保存
レスポンシブインターフェース
- 🖱️ 高度なドラッグ&ドロップ: 直感的なタイムゾーン調整
- ⚡ スムーズなアニメーション: プレミアム体験のための60FPS
- 🎮 タッチコントロール: すべてのデバイスに最適化されたインターフェース
🎯 プロフェッショナルアプリケーション
市場構造分析
- 🏗️ 動的サポート/レジスタンス: 実際のボリュームに基づくレベル
- 📊 高確率ゾーン: 反転エリアの特定
- 🎯 最適なエントリーポイント: 機関投資家の活動に基づく正確なタイミング
機関投資家取引
- 💰 大口ボリュームフットプリント: 機関投資家の活動追跡
- ⚖️ 需給の不均衡: 動きを予測するデルタ分析
- 📈 市場構造のモメンタム: ボリュームベースのブレイクアウト予測
リスク管理
- 🛡️ インテリジェントストップロスゾーン: ボリュームプロファイルに基づく配置
- 🎯 目標ターゲット: バリューエリアに基づく予測
- 📊 最適化されたポジションサイズ: 利用可能な流動性に基づく調整
🏆 競争上の優位性
✅ 次世代インターフェース - 市場で唯一のユニークなフューチャリスティックデザイン
✅ 機関投資家向けパフォーマンス - トレーディングデスクレベルの正確な計算
✅ 完全な柔軟性 - 5つのビジュアルスタイル+完全なカスタマイズ
✅ インテリジェントアラート - 積極的なチャンス検出システム
✅ マルチセッションサポート - 24時間365日のグローバル分析
✅ リアルタイム更新 - 市場状況への即時適応
🔧 簡単な設定
プラグ&プレイインストール
- 📥 購入後すぐにダウンロード
- 📁 ワンクリックインストール プラットフォーム内で
- 🎨 最適化されたプリセットによるガイド付き設定
- 🚀 すべての高度なツールで即時取引開始
含まれるもの:
✅ MA Quant Volume Profile V2.0 フューチャリスティックエディション
✅ 5つの完全なビジュアルスタイル
✅ 高度なアラートシステム
✅ 流動性ヒートマップ
✅ デルタ&モメンタム分析
✅ マルチセッションサポート
✅ プレミアムドキュメント
✅ 生涯アップデート
✅ 優先テクニカルサポート
🔥 なぜMA QUANT V2.0を選ぶのか?
🎯 精密取引
当社独自のアルゴリズムは機関投資家レベルの精度でボリューム分布を分析し、今日の競争激しい市場で必要な優位性を提供します。
🚀 未来志向のデザイン
次世代トレーダー向けに設計された唯一のボリュームプロファイルインジケーター。サイバーパンクの美学とプロフェッショナルな機能性が融合。
📈 実証済みの成果
世界中のプロトレーダーに使用され、MA Quant V2.0は数百万ドルの利益を生み出す勝利トレードの特定に貢献しています。
🛠️ 継続的な革新
定期的なアップデートにより、常に最新の市場分析技術と視覚的強化にアクセスできます。
概要
カスタマーレビュー
5 | 50 % | |
4 | 50 % | |
3 | 0 % | |
2 | 0 % | |
1 | 0 % |


