
Half Trend BT
Indicador
38 compras
Versão 1.0, Mar 2025
Windows, Mac
4.3
Avaliações: 3
Descrição
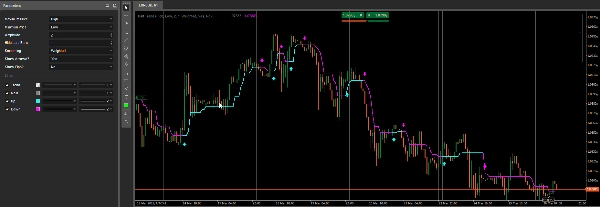
O indicador Half Trend foi projetado para detectar e destacar potenciais reversões de tendência comparando máximas e mínimas recentes ao longo de um período especificado, e então traçando uma linha “Para Cima” ou “Para Baixo” conforme apropriado. Opcionalmente, desenha setas em cada mudança de tendência e pode exibir diferenças em pips entre os sinais.
- Seleção da Série de Máximas/Mínimas
- O indicador usa duas séries de preços (Máxima e Mínima por padrão) para acompanhar máximos e mínimos locais.
- Você pode selecionar diferentes tipos de preços (por exemplo,
Open,Close,Median, etc.) para cada série através de Preço Máximo e Preço Mínimo.
- Médias Móveis e Cálculo do Período
- Uma média móvel (baseada no tipo de Suavização escolhido e no período de Amplitude) é aplicada tanto à série de preços “máximos” quanto “mínimos” selecionada.
- O indicador compara os preços da barra atual com esses níveis suavizados de máximos/mínimos para decidir se deve mudar de uma tendência de alta para uma de baixa (ou vice-versa).
- Detecção e Plotagem da Tendência
- Se o indicador identifica uma tendência de alta, ele plota a linha Para Cima (ciano) e define
Trendpara+1. - Se detectar uma tendência de baixa, ele plota a linha Para Baixo (magenta) e define
Trendpara-1. - A saída Principal (cinza) atualiza internamente para refletir os níveis atuais de suporte/resistência.
Trendé uma série de saída invisível que armazena numericamente a direção da tendência (+1ou-1).
- Se o indicador identifica uma tendência de alta, ele plota a linha Para Cima (ciano) e define
- Setas e Cálculo de Pips
- Mostrar Setas? – Se ativado, o indicador desenha uma seta em cada nova barra onde uma reversão de tendência é detectada.
- Mostrar Pips? – Se ativado, calcula e exibe a diferença em pips entre o último sinal e o novo sinal, desenhando um pequeno rótulo e uma linha de tendência no gráfico.
Resumo
Resumo de IA
The Half Trend BT indicator detects potential trend reversals by analyzing recent highs and lows over a specified period. It compares two selected price series—typically High and Low, but configurable to other price types such as Open, Close, or Median—using moving averages based on chosen smoothing methods and amplitude periods. The indicator plots an "Up" line (cyan) when an uptrend is detected and a "Down" line (magenta) for a downtrend, while internally storing trend direction numerically (+1 or -1). A main output line (gray) reflects current support and resistance levels. Optional features include drawing arrows on bars where trend reversals occur and calculating pip differences between signals, which are displayed as labels and trendlines on the chart. This indicator supports multiple markets including Forex, indices, commodities, cryptocurrencies, and stocks.
Perfil do indicador
Avaliações de clientes
4.3
Avaliações: 3
5 | 33 % | |
4 | 67 % | |
3 | 0 % | |
2 | 0 % | |
1 | 0 % |
Avaliações de clientes
March 29, 2025
Clean idea for traders around chart reading. The useful part is adding confirmation before a trade, with the numbers checked before scaling. The cleaner reads should hold across 3 sessions, not just 1 good chart. It is stronger when a 1.5R target is realistic before the entry.
March 28, 2025
March 28, 2025
Decent tool for testing if the trader wants it makes market context easier to scan. It works best as support, not a final decision maker. I would test it on 2 timeframes, 20 signals and a 1R stop plan. it should not be used as a blind entry trigger.
Conversa
Perguntas frequentes
Prop
Forex
Signal
Indices
Commodities
Crypto
Stocks
Os produtos disponíveis através da cTrader Store, incluindo bots de negociação, indicadores e plugins, são fornecidos por programadores terceiros e são disponibilizados apenas para fins informativos e de acesso técnico. A cTrader Store não é um corretor e não fornece aconselhamento em matéria de investimento, recomendações pessoais ou qualquer garantia de desempenho no futuro.


Preço
48
Vendas
1.04K
Instalações gratuitas