

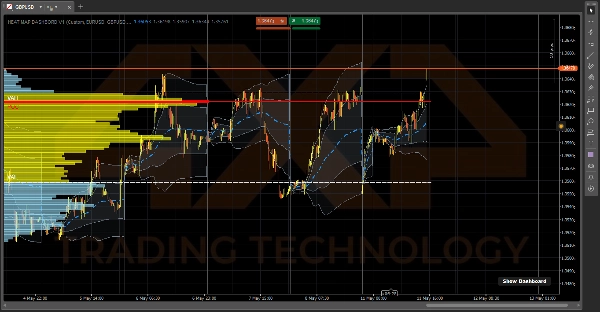

Mô tả
⚠️Cập nhật để tận hưởng thông tin chiều sâu thực sự⚠️
🔥 BẢNG ĐIỀU KHIỂN BẢN ĐỒ NHIỆT 📈
Một Terminal Dòng Lệnh & Đà Tốc Độ cấp Định chế cho cTrader.
Bảng điều khiển Bản Đồ Nhiệt không chỉ là một lớp phủ biểu đồ cơ bản—nó là một hệ sinh thái giao dịch ba phần được tích hợp trực tiếp vào nền tảng của bạn. Nó cung cấp cho bạn tầm nhìn "X-Ray" về thanh khoản thị trường, trung bình trọng số theo khối lượng thực sự, và các xu hướng cấp vĩ mô, tất cả mà không làm chậm máy tính của bạn. ⚡
🎯 Nó làm gì (Góc nhìn của Nhà giao dịch)
Hệ thống chia giao dịch của bạn thành ba bước đơn giản:
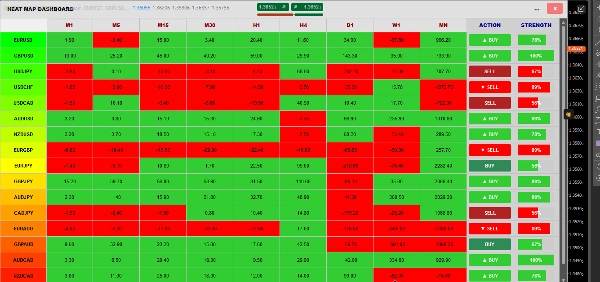
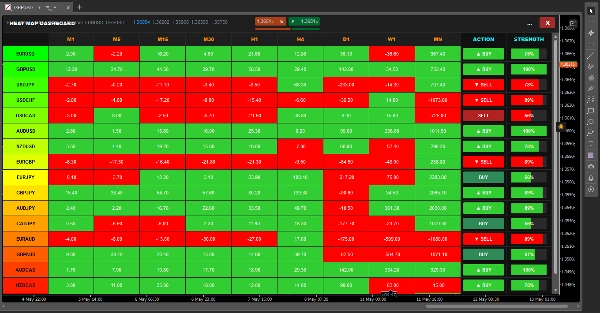
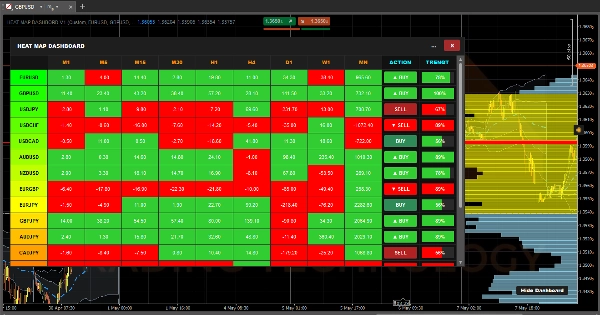
- 🎛️ Bước 1: GIAO DỊCH GÌ (Ma trận). Thay vì phải nhấp qua hàng chục biểu đồ, bảng điều khiển quét 17 tài sản khác nhau trên 9 khung thời gian (M1 đến Hàng tháng). Nó tính toán đà cho từng ô và mã màu chúng. Chỉ cần nhìn thoáng qua, bạn biết chính xác cặp nào đang trong xu hướng lớn và sẵn sàng để giao dịch.
- 🌊 Bước 2: AI đang kiểm soát (VWAP). Khi bạn chọn một cặp, hãy nhìn vào VWAP Neo hàng ngày. Nó cho bạn thấy giá trung bình thực dựa trên khối lượng, không chỉ là các cây nến. Các đám mây Độ lệch Chuẩn được tô bóng hoạt động như hỗ trợ/kháng cự động, cho bạn biết chính xác khi nào thị trường bị mua quá mức hoặc bán quá mức.
- 📊 Bước 3: VÀO ĐÂU (VRVP). Cuối cùng, Hồ sơ Khối lượng Phạm vi Hiển thị vẽ chính xác nơi thanh khoản định chế lớn đang tập trung. Nó tự động vẽ Điểm Kiểm soát (POC) và 70% Khu vực Giá trị (VAH & VAL), cung cấp cho bạn các mức chính xác để thực hiện các điểm vào và thoát lệnh.
⚙️ Cách hoạt động (Bên trong)
Hầu hết các chỉ báo cố gắng làm toán nhiều như vậy sẽ ngay lập tức làm đóng băng nền tảng và làm cTrader sử dụng CPU 100%. Để tránh điều đó, Bảng điều khiển Bản đồ Nhiệt được vận hành bởi ba động cơ độc lập, tối ưu cao chạy đồng thời:
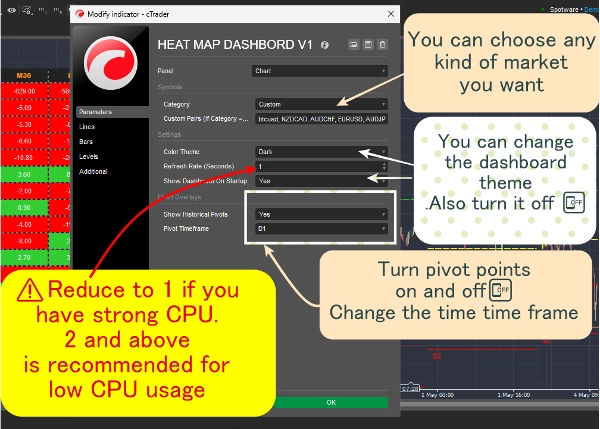
1. Động cơ Bảng điều khiển (Nhịp tim 2 giây) ⏱️ Nếu chúng tôi tính toán 153 tổ hợp (17 cặp x 9 khung thời gian) trên mỗi nhịp giá, máy tính của bạn sẽ bị quá tải. Thay vào đó, động cơ này chạy theo một bộ đếm nhịp tim 2 giây nghiêm ngặt. Mỗi 2 giây, nó lặng lẽ xem giá của 14 cây nến trước, so sánh với giá hiện tại, và tô màu ô xanh (đà tích cực) hoặc đỏ (đà tiêu cực).
2. Động cơ VRVP (Trình đọc màn hình) 🖥️ Thay vì tải hàng ngàn thanh dữ liệu lịch sử, Hồ sơ Khối lượng hoạt động như một "Người nghe Khung nhìn" động. Nó chỉ kích hoạt khi bạn phóng to hoặc cuộn biểu đồ. Nó hỏi cTrader chính xác những cây nến nào đang hiển thị trên màn hình của bạn, tính toán khối lượng chồng lấp chính xác cho các thanh đó, và ngay lập tức vẽ lại Khu vực Giá trị 70%.
3. Động cơ VWAP (Bộ tích lũy Tick) 🧮 VWAP là thứ duy nhất tính toán trên tick trực tiếp. Tuy nhiên, để giữ cho nó nhanh như chớp, nó sử dụng một "Chuỗi Dữ liệu Tích lũy" nhẹ. Thay vì tính lại cả ngày mỗi giây, nó chỉ thêm khối lượng tick mới vào tổng nền đang chạy, và tự động xóa sạch chính xác vào giây đồng hồ điểm nửa đêm.
4. Trình quản lý cửa sổ (Kẻ biến hình) 🪟 Bảng điều khiển được bao bọc trong logic kích thước C# tùy chỉnh lắng nghe màn hình của bạn. Khi bạn nhấn nút Phóng to [ ] hoặc Khôi phục [=], chỉ báo đọc động Chart.Width và Chart.Height theo thời gian thực, ngay lập tức biến hình để phù hợp hoàn hảo với màn hình của bạn mà không bị sụp đổ!
Tóm tắt
1. Market Momentum Matrix: Scans 17 assets across 9 timeframes (from 1 minute to monthly), calculating and color-coding momentum to identify trending pairs quickly.
2. Daily Anchored Volume Weighted Average Price (VWAP): Displays true average prices weighted by volume, with dynamic standard deviation clouds indicating overbought or oversold conditions.
3. Visible Range Volume Profile (VRVP): Maps institutional liquidity by highlighting the Point of Control (POC) and 70% Value Area (VAH & VAL) within the visible chart range, aiding precise entry and exit levels.
The dashboard operates via four optimized engines: a 2-second heartbeat engine for momentum updates, a viewport-driven VRVP engine for volume profile recalculations, a tick-accumulating VWAP engine for real-time volume-weighted pricing, and a dynamic window manager that adjusts the interface to fit the chart size. This architecture ensures efficient performance and real-time responsiveness. The indicator supports visualization, signals (including trend strength, breakouts, and reversals), and filtering based on tick data, volume, and market structure analysis. It is tagged for aggressive trading, market structure, liquidity sweeps, support/resistance, and risk dashboard functionalities.
Đánh giá của khách hàng
5 | 67 % | |
4 | 33 % | |
3 | 0 % | |
2 | 0 % | |
1 | 0 % |
Thảo luận
Câu hỏi thường gặp


























Giá