
Opis
Ten wskaźnik analizy technicznej dostarcza informacji o nastrojach rynkowych, trendach i poziomach cen. Wykorzystuje dane takie jak Wolumen, Open_Close, Chaikin Volatility oraz Chaikin Money Flow do obliczania nastrojów rynkowych. Pozwala również na dostosowanie spreadów, wykrywanie trendów oraz wizualizację poziomów cen i pipsów. Jest to przydatne narzędzie do identyfikacji dominującej siły na rynku, przewidywania ruchów cen oraz poprawy podejmowania decyzji handlowych.
W opisie wskazuję ważne parametry; pozostałe to konfiguracje stylu, takie jak kolor, typ linii i rozmiar czcionki.
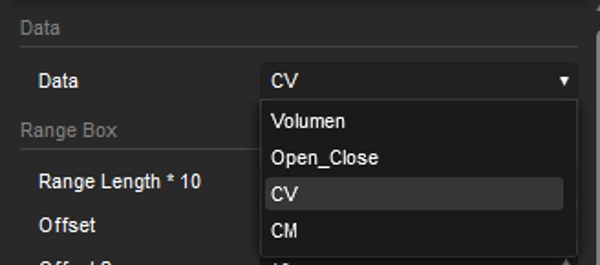
Dane
Obliczenia nastrojów opierają się na wyborze spośród Wolumenu, Open_Close, Chaikin Volatility oraz Chaikin Money Flow.
Długość zakresu * 10
Wartość wskazuje liczbę świec (okresów), na których opiera się obliczenie – wartość jest mnożona przez 10.
Dodaj zoom
Aby utrzymać wykres wyśrodkowany, pomaga to również uwzględnić sytuacje takie jak konsolidacja i zmiany trendu.
Margines
Pozwala na dostosowanie górnych i dolnych marginesów w celu poprawy wizualizacji.
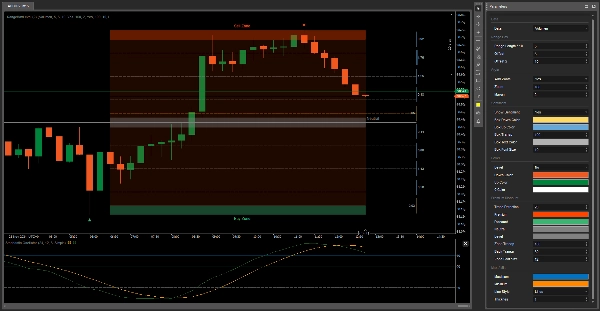
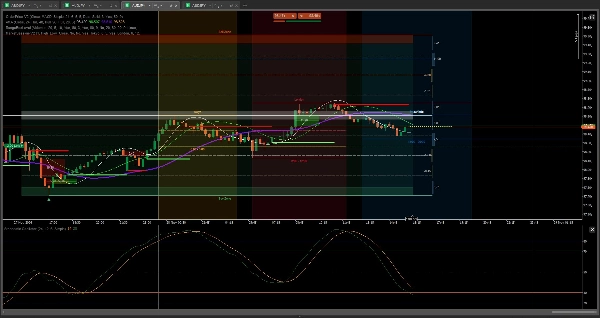
Pokaż nastroje
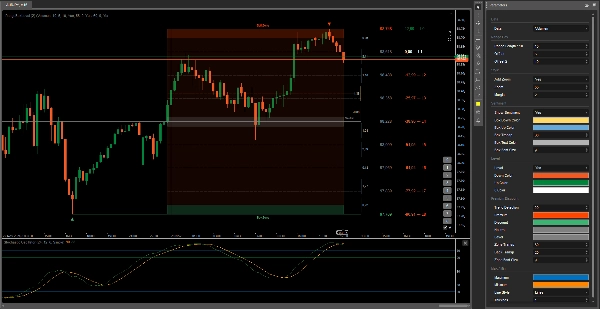
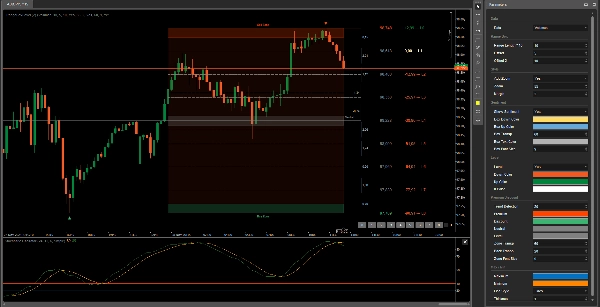
Nastroje wskazują, która siła jest obecnie silniejsza na rynku. Jeśli żółte słupki rosną, oznacza to, że jest więcej sprzedających, i odwrotnie. Jeśli nie chcesz widzieć wizualizacji nastrojów, możesz ją ukryć po prawej stronie.
Poziom
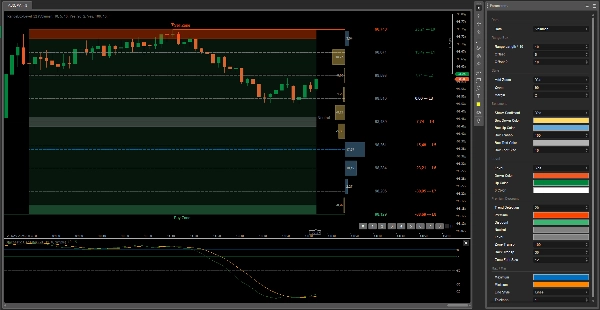
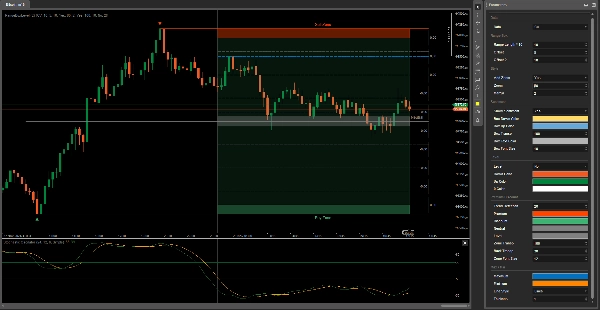
To dodatkowa funkcja, która może służyć jako odniesienie dla cen i pipsów na każdym poziomie. Gdy wybierzesz poziom, na którym chcesz złożyć zlecenie kupna, wskazuje pipsy na każdym poziomie, które cena może osiągnąć.
Wykrywanie trendu
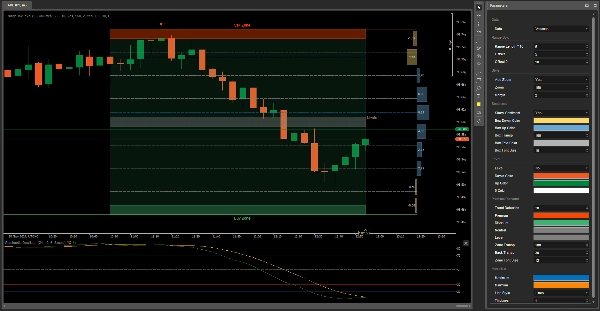
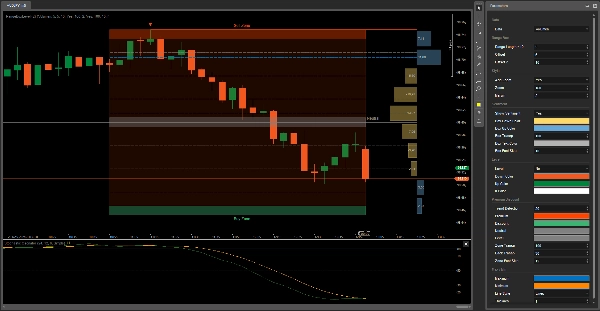
W zależności od trendu aktywa, tło Range Box zmienia się: zielone, jeśli jest byczy, i czerwone, jeśli jest niedźwiedzi.
Max / Min
To niebieskie i żółte linie, które zmieniają swoje położenie zgodnie z przewidywaniem, dokąd może zmierzać cena. Range Box jest podzielony na 9 sekcji, aby pomóc określić punkty zwrotne ceny, służąc jako zniesienie Fibonacciego.
Będziesz niepokonany
Powodzenia 😀
Podsumowanie
Key features include sentiment visualization with bars indicating the dominance of buyers or sellers, trend detection through background color changes (green for bullish, red for bearish), and level indicators that display potential price and pip targets for placing orders. The Range Box is divided into nine sections to identify price inflection points, functioning similarly to Fibonacci retracement levels, with dynamic max/min lines predicting possible price movements.
This tool supports analysis across various markets including stocks, cryptocurrencies, indices like NAS100, and commodities such as XAUUSD (gold). It is suitable for trading strategies like scalping and grid trading and can assist traders in anticipating price movements and making informed decisions. The indicator integrates with additional tools for enhanced order price management and market session analysis.
Opinie klientów
5 | 100 % | |
4 | 0 % | |
3 | 0 % | |
2 | 0 % | |
1 | 0 % |


![Logo „Wyckoff Toolkit [Iridio Capital]”](https://cdn.ctrader.com/image/webp/8acfe6a1-6a8e-4578-9367-9df3af2b1801_27763)


