
Opis
Dlaczego Rook Footprint?
Niezależnie od tego, czy potwierdzasz wybicia, identyfikujesz potencjalne odwrócenia, monitorujesz udział rynku, czy analizujesz płynność, Rook Footprint dostarcza profesjonalne narzędzia do analizy przepływu zleceń w szybkim, przejrzystym i intuicyjnym pakiecie.
Stworzony dla traderów, którzy chcą głębszego wglądu w rynek bez zbędnej komplikacji.
Funkcje
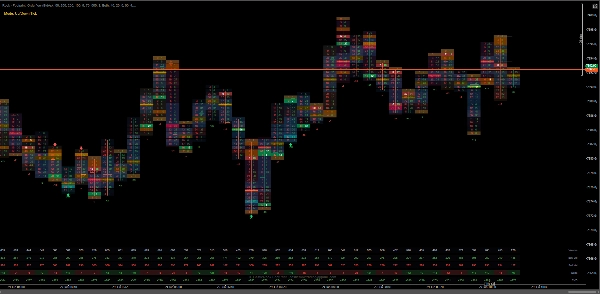
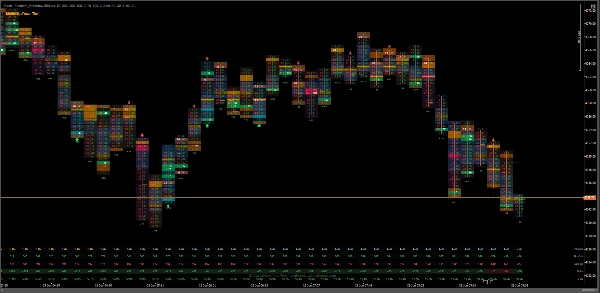
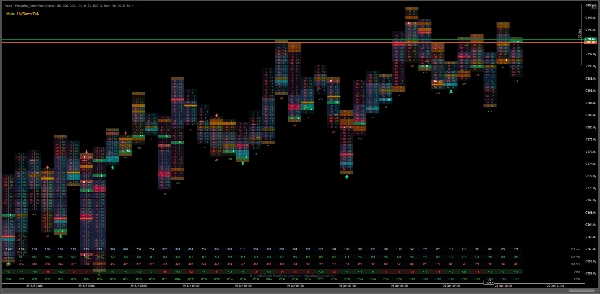
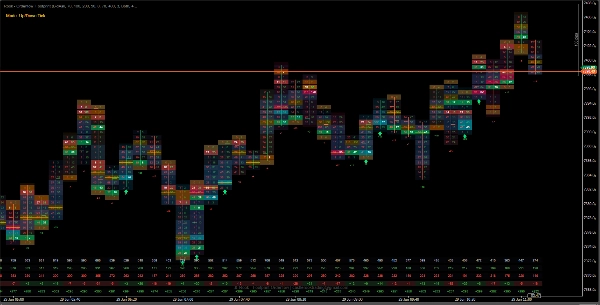
Wizualizuj aktywność kupna i sprzedaży na każdym poziomie cenowym z czystym wyświetlaczem footprint oraz inteligentną wizualizacją heatmapy.
- Automatycznie wykrywa dostępne dane brokera.
- Używa Bid Ask gdy jest dostępne.
- Automatycznie przełącza się na tryb Up Down Tick gdy dane Bid/Ask są niedostępne.
Analiza przepływu zleceń
- Wykrywanie nierównowagi
- Stosowane strefy nierównowagi
- Wykrywanie absorpcji
- Wykrywanie wyczerpania
- Analiza delty
Zaprojektowany, aby pomóc zidentyfikować ważne obszary aktywności kupna i sprzedaży z wyraźną prezentacją wizualną.
Panel statystyk
Monitoruj podstawowe statystyki rynku dla każdej świecy footprint, w tym:
- Całkowity wolumen
- Wolumen kupna
- Wolumen sprzedaży
- Delta
- Skumulowana delta (CVD)
Wszystkie statystyki są prezentowane w czystym, łatwym do odczytania układzie bezpośrednio pod wykresem.
Zaprojektowany z myślą o przejrzystości i wydajności
Rook Footprint kładzie nacisk na czytelność bez zbędnego bałaganu.
- Profesjonalna wizualizacja heatmapy
- Łatwe do odczytania statystyki
- Możliwość dostosowania kolorów i wyglądu
Wszystko zostało zaprojektowane, aby pomóc Ci szybko interpretować przepływ zleceń, jednocześnie utrzymując wykresy czyste i skoncentrowane.
Działa z:
- Forex
- Futures
- Indeksy
- Surowce
- Kryptowaluty
Obsługuje wszystkie interwały czasowe wykresów i automatycznie dostosowuje się do danych rynkowych dostępnych od Twojego brokera.
Dla najlepszych wrażeń:
- Korzystaj z brokerów, którzy dostarczają wysokiej jakości dane tickowe.
- Zwiększ "Ticks" na instrumentach o wysokiej zmienności, jeśli preferujesz czystszy wyświetlacz.
- Zmniejsz liczbę "widocznych świec do wyświetlenia" na komputerach o niższej mocy.
- Łącz analizę footprint z istniejącą strategią handlową zamiast używać jej jako samodzielnego sygnału.
Wymagania
- C trader Desktop (Windows lub macOS)
- Nie wymaga zewnętrznych źródeł danych
- Wykorzystuje wbudowane dane rynkowe C Trader
- Prawa dostępu: brak
Kategoria: Wolumen / Przepływ zleceń
Tagi: footprint, przepływ zleceń, bid ask, up/down tick, delta, skumulowana delta, analiza wolumenu, nierównowaga, absorpcja, wyczerpanie, płynność, wsparcie opór,
Zastrzeżenie :
Handel na rynkach finansowych wiąże się z dużym ryzykiem, a wyniki historyczne nie gwarantują przyszłych rezultatów.
Informacje o przepływie zleceń pochodzą z danych rynkowych udostępnianych przez Twojego brokera za pośrednictwem C Trader. Gdy dostępne są prawdziwe dane Bid/Ask, wskaźnik automatycznie wykorzystuje je do obliczeń footprint. W przeciwnym razie używa estymacji Up/Down Tick. Jakość danych i dostępne funkcje mogą się różnić w zależności od brokera i instrumentów. Ten wskaźnik jest narzędziem analitycznym i nie stanowi porady finansowej, inwestycyjnej ani handlowej.
Podsumowanie
Key order flow analysis features include imbalance detection, stacked imbalance zones, absorption and exhaustion detection, and delta analysis. A statistics panel beneath the chart presents total volume, buy and sell volume, delta, and cumulative delta (CVD) in an easy-to-read format.
Rook Footprint supports all chart timeframes and adapts automatically to the market data provided by the broker. It is compatible with multiple markets including Forex, Futures, Indices, Commodities, and Crypto. The indicator emphasizes clarity and performance with customizable colors and a clutter-free layout to facilitate quick interpretation of order flow.
No external data feeds or special access rights are required, as it uses cTrader’s built-in market data. It is intended as an analytical tool to complement existing trading strategies.


![Logo „Wyckoff Toolkit [Iridio Capital]”](https://cdn.ctrader.com/image/webp/8acfe6a1-6a8e-4578-9367-9df3af2b1801_27763)


